Facebook Ads Benchmarks for B2B SaaS: CPL, CTR and Demo Sign-Up Costs to Expect
There is no single Facebook Ads benchmark for B2B SaaS that you can paste into a slide and call done. Cost per lead, click-through rate, and demo or trial sign-up cost swing widely by audience, offer, season, and how qualified a “lead” has to be before sales touches it. The honest way to read Facebook Ads benchmarks for B2B SaaS is to learn the formulas, understand what moves each metric, and then judge your numbers against your own goals and your own prior period. This post walks through the SaaS Meta Ads metrics that matter, how to calculate them, and how to set a target that fits your funnel instead of a number you found in a chart.
Why a universal SaaS benchmark misleads you
A B2B SaaS cost per lead from a broad awareness campaign and a CPL from a high-intent demo-request campaign are not the same thing, even inside the same account. Lumping them together hides the story.
Several factors move these numbers, and none of them are constant:
- Auction demand. More advertisers competing for the same audience pushes CPM up, which pushes every downstream cost up.
- Audience size and targeting. Narrow, senior, high-value job audiences cost more to reach than broad ones.
- Objective and offer. A free trial, a gated guide, and a booked demo carry very different intent and therefore very different costs.
- Season. Q4 retail demand and budget cycles change auction pressure for everyone, B2B included.
- Creative and landing page. A clearer message lifts CTR and conversion rate, which lowers CPL without touching budget.
Because all of these vary by account, the most reliable benchmark is your own history. A published median tells you what someone else’s blended account looked like in a window you cannot see. Your last 90 days tell you what your funnel actually does.
The SaaS Meta Ads metrics that matter
For most B2B SaaS accounts, four metrics carry the weight. Track these as your core SaaS lead gen benchmark set.
- CTR (click-through rate). CTR = clicks / impressions. This is your first read on whether the creative and audience match. A weak CTR usually means the message or the targeting is off before you ever look at cost.
- CPC (cost per click). CPC = spend / clicks. Driven largely by CPM and CTR. If CPM rises or CTR falls, CPC climbs.
- CPM (cost per 1,000 impressions). CPM = spend / impressions times 1,000. This is your auction-pressure gauge. A jump here lifts everything downstream.
- CPL (cost per lead). CPL = spend / leads. The headline number for lead gen, but only meaningful once you define what counts as a lead.
For SaaS specifically, the demo signup cost benchmark and trial sign-up cost are the metrics that connect ad spend to pipeline. Treat a demo request or a started trial as your real “result,” and calculate cost per result the same way: spend divided by the number of those actions.
Defining a “lead” before you benchmark CPL
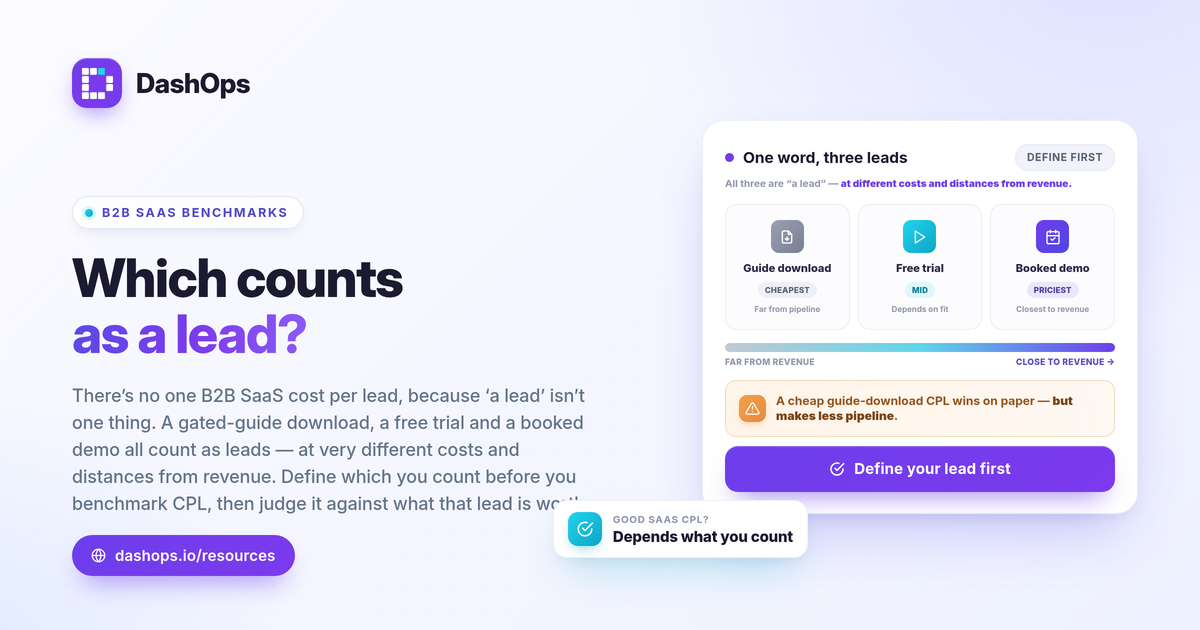
The biggest reason two SaaS accounts report wildly different B2B SaaS cost per lead is that they count different things. Before you compare anything, write down what a lead is for you.
- A form fill from a gated asset is cheap and plentiful, and far from sales-ready.
- A booked demo costs more per unit but sits much closer to revenue.
- A started free trial sits somewhere in between and depends heavily on product fit.
A low CPL on cold guide downloads can look better than a higher CPL on demo requests while producing less pipeline. This is why cost per lead and lead quality have to be read together. If you only chase a lower CPL number, you can optimize toward cheaper, worse leads. For more on that tension, see cost per lead vs lead quality on Meta Ads.
How to set your own target instead of borrowing one
You can back into a defensible CPL or demo-cost target from your own economics, no external benchmark required.
- Start from value. Estimate the revenue or pipeline value of one closed customer.
- Work back through your funnel. Apply your real close rate from demo to customer, and from lead to demo. That tells you how much a demo or a lead is worth to you.
- Set a ceiling. Your acceptable cost per demo is some fraction of that value, sized to your margin and payback period.
- Compare to your trend. Pull this period against last period. Improving on yourself is the benchmark that actually matters.
This is also where break-even thinking helps for paid-trial or self-serve motions: break-even ROAS = 1 / profit margin gives you the return you need before a campaign is net positive. The same logic, applied to a sales-led funnel, gives you a CPL ceiling.
Reading the metrics as a system
These numbers move together, so read them as a chain rather than in isolation.
- If CPL rises, check CPC first. If CPC rose, check CPM and CTR.
- A CPM jump with steady CTR usually means auction pressure or audience saturation, not a creative problem.
- A CTR drop with steady CPM usually means the creative or audience is fatiguing.
Frequency is the tell for that last case. Rising frequency alongside a falling CTR is a classic fatigue signal, which you can see directly in a demographic, placement, and frequency view rather than guessing. For a fuller list of what to watch, see the Meta Ads KPIs to track.
One more SaaS-specific reporting note
Two reporting realities hit SaaS lead gen hard. First, iOS and App Tracking Transparency cause conversions to be undercounted, so your dashboard may show fewer demos than your CRM records. Reconcile platform numbers against your CRM rather than trusting either alone. Second, if you capture leads through Meta Instant Forms, Meta only lets you download those leads directly from the Page for a limited window of about 90 days, after which you retrieve them through the API or a connected tool. Export on a schedule so nothing ages out.
How DashOps fits
DashOps reads your Meta KPIs into one dashboard and adapts the view for lead gen, surfacing cost per lead, cost per result, and the demographic, placement, and frequency breakdowns that explain a moving CPL. Because period-over-period comparison is built in, you benchmark against your own prior period instead of a borrowed median, and you can export or schedule the report for stakeholders. See what each plan includes on the pricing page, and the help center covers connecting an ad account and setting up lead export. If you want a closer look at how a live dashboard differs from raw exports, see Ads Manager vs a reporting dashboard.
The most useful B2B SaaS benchmark is the one you build from your own funnel math and last period’s numbers, not a figure you found in someone else’s chart.
Frequently asked questions
What is a good cost per lead for B2B SaaS on Facebook Ads?
How do I benchmark demo or trial sign-up cost?
Why does my CRM show fewer SaaS leads than Meta reports?
See it in your own dashboard
DashOps brings Meta Ads reporting, campaign management, and white-label client portals into one place. Pick the plan that fits how you run ads.