How to Track Average Order Value From Your Facebook Ads
Average order value tells you how much each ad-driven purchase is worth, and it is one of the few e-commerce numbers ROAS alone can hide. Facebook Ads average order value is the conversion value Meta attributes to your ads divided by the purchases that produced it: AOV = conversion value / purchases. Track it next to ROAS and purchases, and you can see whether a result came from more orders, bigger orders, or cheaper traffic. This guide explains why AOV belongs in every e-commerce report, how to derive it from the numbers Meta already returns, and how to read its trend honestly.
Why AOV belongs next to ROAS
ROAS answers “did the money come back,” but it does not tell you how. Two accounts can post the same ROAS while behaving completely differently: one wins on volume of small orders, the other on a handful of large ones. Average order value separates those stories.
- It explains ROAS movement. If ROAS rose this period, AOV tells you whether buyers spent more per order or you simply paid less per click.
- It connects ads to margin. A higher AOV usually carries more contribution per order, which is what actually funds your spend.
- It flags audience shifts. When AOV drifts up or down, the mix of who is buying has often changed, even if total purchases look steady.
For how AOV sits among the other numbers worth watching, see the Meta Ads KPIs to track overview.
How to derive AOV from Meta’s numbers
Meta does not hand you an average order value field, but it gives you the two inputs. You build AOV the same way you build ROAS, from purchases and conversion value over a single window.
- Conversion value. The total purchase value Meta attributes to your ads in the date range.
- Purchases. The count of attributed purchase events in that same range.
- The formula. AOV = conversion value / purchases. For a quick sanity check, ROAS divided by cost per purchase, times your spend, lands you back near the same figure because both come from the same source numbers.
Keep the date range and the attribution setting identical to your ROAS calculation. If one report uses a 7-day window and another uses 1-day, the AOV will not line up, and neither will anything else.
Track AOV from ads as a trend, not a snapshot
A single AOV number means little on its own. The value comes from watching it move. A period-over-period comparison shows whether this month’s orders were larger, smaller, or about the same as last month’s, which is the question that actually changes decisions.
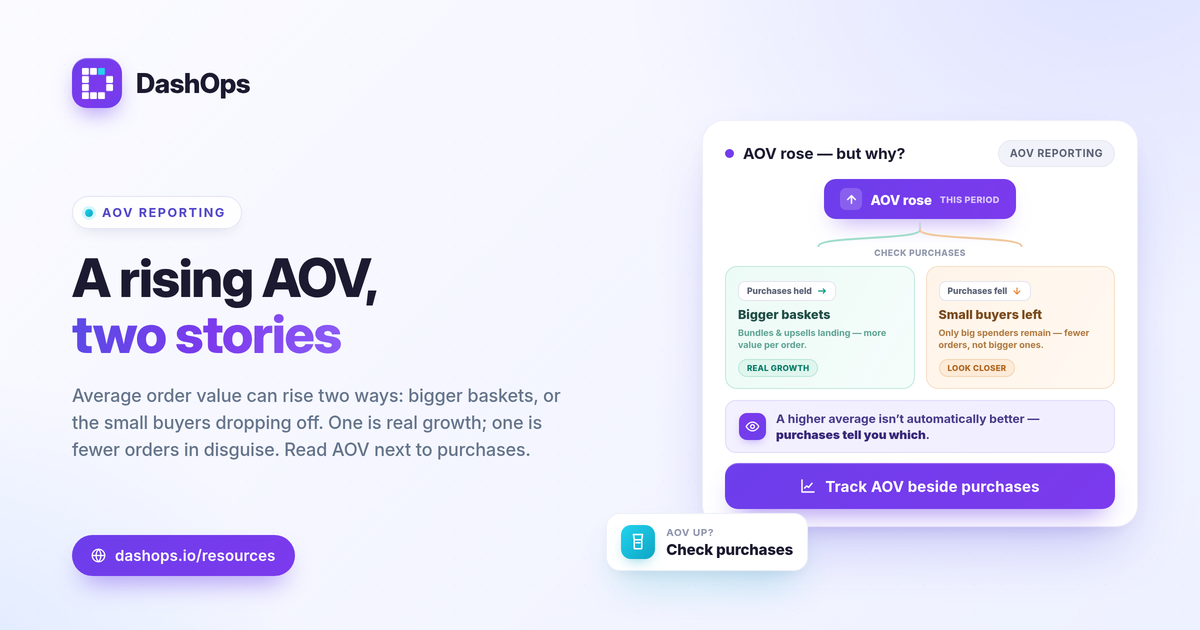
- AOV up, purchases steady. Buyers are spending more per order. Often a sign that bundles, upsells, or a higher-priced audience are working.
- AOV up, purchases down. Be careful. The average can rise simply because low-value buyers dropped off and only big spenders remained, which can mean fewer total orders.
- AOV down, purchases up. A discount or a broader audience may be pulling in more, smaller orders. Whether that is good depends on your margin.
There is no universal “good” AOV. Judge it against your own product pricing, your contribution margin, and your prior-period trend, not a benchmark from someone else’s store. If you want to connect AOV back to profitability, pair it with your break-even ROAS, which is 1 divided by your profit margin.
Reconcile Meta AOV with your store
The average order value Meta reports will rarely match the figure in your store admin, and that is expected. Meta counts only the orders it attributes to ads within your chosen window. Your store counts every order from every channel. On top of that, iOS privacy changes cause Meta to undercount some conversions, which can pull attributed value and purchase counts below reality.
Treat Meta’s AOV as the average value of ad-attributed orders, and your store’s AOV as the blended figure across all traffic. Both are useful. The Meta number tells you what your ads are bringing in; the store number tells you the whole picture. For the wider gap between platform and store sales counts, the difference between Ads Manager and a reporting dashboard is a useful frame, because a dashboard is where you line these views up side by side.
Put AOV in the report your reader actually reads
For an e-commerce report, AOV earns a spot in the headline block, right next to spend, purchases, ROAS, and cost per purchase. Together those five answer the real question: did the money work, and what drove the result.
- Lead with the goal metrics. Spend, purchases, ROAS, then AOV as the “how” behind the return.
- Always show the comparison. Last period beside this one, so AOV is read as a direction, not a static figure.
- Add context for clients. A client looking at a white-label report needs one line explaining whether AOV rose because orders got bigger or volume thinned out. If you send reports to clients, white-label client reporting covers presenting these numbers under your own brand.
How an adaptive dashboard handles it
The tedious part of AOV is that you have to pull conversion value and purchases for the same window, every period, for every ad account, and then divide. An adaptive e-commerce AOV dashboard does that for you and knows to surface AOV only when an account is running sales objectives rather than lead generation. DashOps reads spend, purchases, conversion value, ROAS, and the derived average order value KPI across your Meta ad accounts in one dashboard, with period-over-period comparison built in, so the trend is there without a spreadsheet. See what each plan includes on the pricing page, and the help center walks through connecting an ad account.
The practical takeaway: report AOV beside ROAS and purchases every period, and read it as a trend so you know whether bigger orders or just more of them moved the number.
Frequently asked questions
How do you calculate average order value from Facebook Ads?
Why does AOV from Meta differ from AOV in Shopify?
Is a higher average order value always better?
See it in your own dashboard
DashOps brings Meta Ads reporting, campaign management, and white-label client portals into one place. Pick the plan that fits how you run ads.