E-commerce Meta Ads KPIs to Track: The Metrics That Actually Predict Revenue
A clean ecommerce Meta Ads report answers one question for whoever reads it: did the ad spend turn into profitable sales, and what changed since last period. The ecommerce Meta Ads KPIs that actually predict revenue are a short list: ROAS, purchases, average order value, and cost per purchase. Everything else is either an input to those four or a vanity number that feels good and decides nothing. Adaptive dashboards matter here because they surface the e-commerce Facebook Ads metrics tied to sales and push impressions, reach and raw clicks into the background where they belong.
Start with the four that move revenue
For a store, these are the Meta Ads e-commerce KPIs that decide whether you scale, hold, or cut.
- Purchases. The count of orders Meta attributes to your ads. This is the volume signal: are sales actually happening, and how many.
- ROAS (return on ad spend). ROAS = conversion value / spend. The efficiency signal. It tells you how much sales value each dollar of spend returned.
- Average order value (AOV). AOV = conversion value / purchases. The basket signal. Two campaigns with the same ROAS can have very different AOV, and the higher-AOV one is usually healthier.
- Cost per purchase. Cost per purchase = spend / purchases. The acquisition signal. What it costs you to buy one order, before you factor in margin.
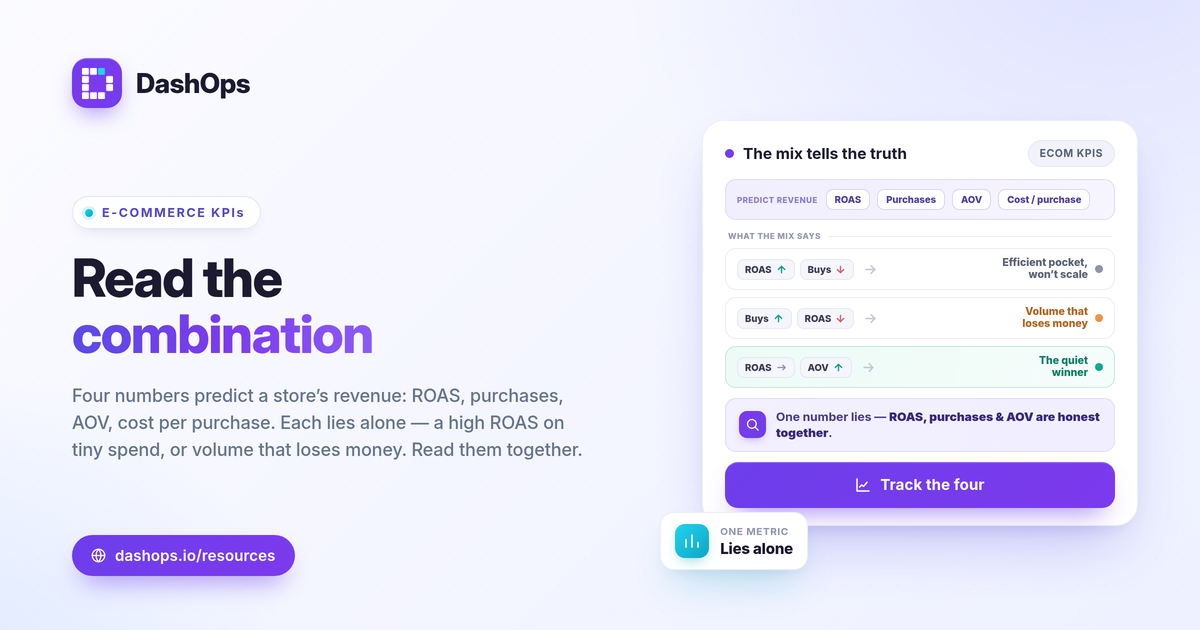
Read these together, never alone. ROAS without purchases can be a fluke on tiny spend. Purchases without ROAS can be unprofitable volume. The combination of ROAS, purchases and AOV is the honest picture of revenue.
Why generic dashboards bury the metrics that matter
Most reporting tools show the same fixed grid to everyone: impressions, reach, frequency, clicks, CTR, CPC, CPM. For an awareness campaign those are fine. For a store trying to predict revenue, they are mostly noise. A wall of impressions and clicks tells you nothing on its own about whether the money turned into sales.
An adaptive dashboard reads the campaign objective and swaps the headline cards. When the account is e-commerce, ROAS, purchases, AOV and cost per purchase move to the front; when it is lead-gen, cost per lead and lead volume take their place. The DTC ad metrics to track are the ones tied to a sale, and the dashboard should make that the default view, not something you dig for.
ROAS, purchases and AOV: read them as a system
The phrase “ROAS purchases AOV” is worth treating as one unit, because each one corrects the blind spot in the others.
- High ROAS, low purchases usually means a small, efficient pocket of spend. Good signal, but it will not grow the business until you can scale it without ROAS collapsing.
- High purchases, low ROAS means you are buying orders that do not pay for themselves. Volume that loses money is not a win.
- Steady ROAS, rising AOV is often the quiet winner. You are selling bigger baskets at the same efficiency, which lifts profit even if order count is flat.
A period-over-period view is what turns these from snapshots into a story. Last month versus this month on the same three numbers answers the real question: is this account getting better or worse. For more on the return metric itself, see what is ROAS for Meta ads.
What “good” actually means for a store
There is no universal “good ROAS” or “good cost per purchase.” Anyone who quotes one is guessing. The honest way to judge an ecommerce KPI is against three of your own reference points.
- Your margin. Use break-even ROAS = 1 / profit margin. A 50 percent margin gives a break-even ROAS of 2.0; a 25 percent margin needs 4.0 just to cover costs. Your target sits above break-even, with room for profit. See how to calculate break-even ROAS for the full working.
- Your own trend. Is cost per purchase rising or falling versus last period at the same spend level. The direction matters more than the absolute number.
- Your goal. A launch chasing new customers can accept a lower ROAS than a mature account milking a proven product. The same number is good or bad depending on what you are trying to do.
Watch the supporting signals, but don’t lead with them
Clicks, CTR, CPC and CPM are inputs, not outcomes. They earn a place on the report as diagnostics, not headlines. If ROAS drops, these tell you where to look.
- CPM rising (CPM = spend / impressions times 1000) often signals auction pressure or audience fatigue. Frequency as a KPI helps here: when the same people see your ad too often, CPM and cost per purchase tend to climb together.
- CTR falling points at the creative or the offer, not the landing page.
- CTR steady but cost per purchase rising points past the click, at the product page, price, or checkout.
Demographic and placement breakdowns turn these diagnostics into action: you can see whether one age band, gender, or placement is dragging the average. That is the difference between knowing ROAS fell and knowing why.
A short reporting hierarchy for ecommerce
When you build the report, order the KPIs by how directly they predict revenue.
| Tier | KPIs | Why it leads |
|---|---|---|
| Revenue outcomes | ROAS, purchases, conversion value, AOV | The money question, answered |
| Acquisition cost | Cost per purchase, spend, spend pacing | What you paid to get there |
| Diagnostics | CTR, CPC, CPM, frequency | Why the outcomes moved |
| Context | Impressions, reach, clicks | Scale, not success |
Lead with the top tier. Keep the bottom tier available but out of the spotlight. A client glancing at the report should see revenue and efficiency first, every time.
DashOps reads all of these straight from your connected Meta ad accounts and adapts the dashboard to your objective, so an e-commerce account leads with ROAS, purchases, AOV and cost per purchase instead of a generic KPI wall, with period-over-period comparison built in. See what each plan includes on the pricing page, and the help center covers connecting an ad account and reading the numbers. If you also want a deeper look at the full metric set across objectives, the Meta Ads KPIs to track guide is the companion to this one.
The practical takeaway: build every ecommerce report around ROAS, purchases, AOV and cost per purchase, judge them against your own margin and last period, and treat everything else as supporting detail.
Frequently asked questions
What is the single most important ecommerce Meta Ads KPI?
How do I calculate break-even ROAS for my store?
Why does my dashboard show different purchases than Shopify?
See it in your own dashboard
DashOps brings Meta Ads reporting, campaign management, and white-label client portals into one place. Pick the plan that fits how you run ads.