Cross-Channel Reporting Suites vs a Meta-Only Dashboard: Which Should You Pick?
If most of your spend runs on Facebook and Instagram, the Meta-only dashboard vs cross-channel reporting choice is simpler than it looks: pick the tool that goes deepest on the channel you actually run. A cross-channel suite earns its keep when you genuinely blend several platforms into one view. But a Facebook Ads dedicated dashboard gives a mostly-Meta advertiser more KPIs, more native breakdowns, and usually lower cost, because you are not paying for connectors to channels you never open. Below is how to decide based on your spend mix, your reporting needs, and your budget, rather than on a feature list that looks impressive but does not match how you work.
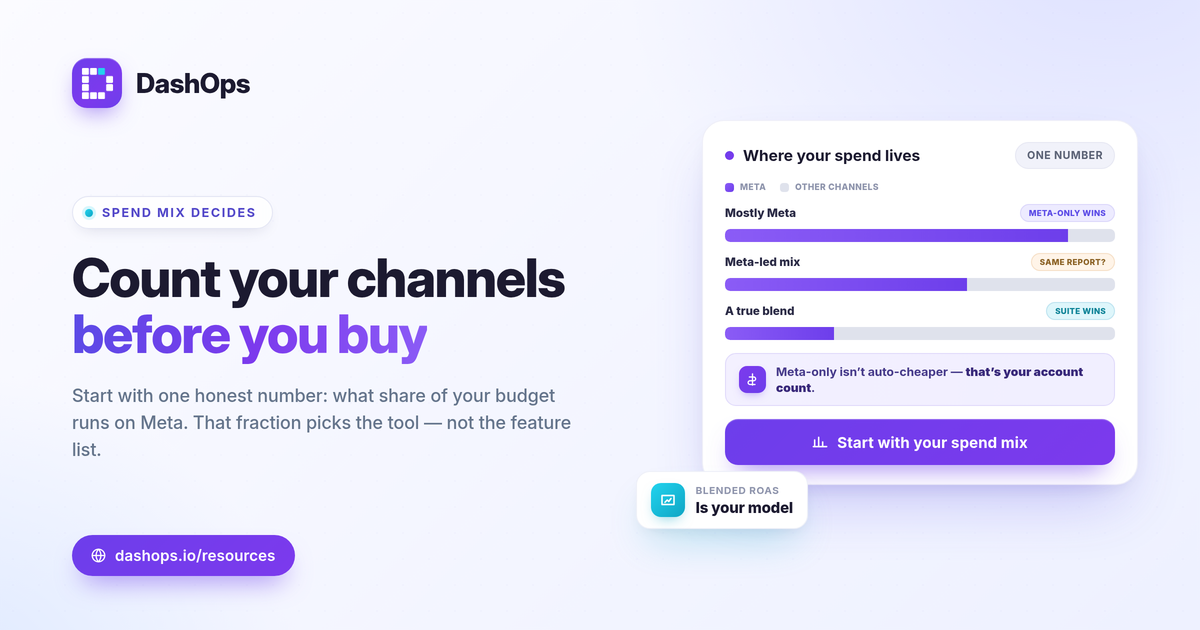
Match the tool to where your spend actually lives
Start with one honest number: what share of your paid budget runs through Meta. That fraction, more than any feature checklist, points to the right tool.
- Mostly or only Meta. If Facebook and Instagram are your main paid channel, a Meta Ads only reporting tool covers nearly all your spend with depth a generalist suite rarely matches per channel.
- A true blend across platforms. If Google, TikTok, LinkedIn, and email each carry real budget and you need them side by side in one report, an all-in-one marketing dashboard alternative does a job a single-channel tool cannot.
- Mixed, but Meta-led. Many advertisers run a little of everything but concentrate spend on Meta. Here the deciding question is whether the other channels need to live in the same report or can be reported separately.
The common mistake is buying a wide suite for the promise of “everything in one place,” then using only the Meta tab. You pay for breadth you do not touch and accept shallower Meta reporting in exchange.
Where a Meta-specialized dashboard goes deeper
A tool built for one platform can model that platform properly instead of flattening every channel into a lowest-common-denominator schema.
- More native KPIs. A Meta Ads reporting platform can surface 17 or more Meta KPIs together, including spend, impressions, reach, frequency, clicks, CPC, CPM, CTR, ROAS, purchases, leads, and cost per lead, with the formulas behind them intact (CTR = clicks / impressions; CPC = spend / clicks; ROAS = conversion value / spend; cost per lead = spend / leads).
- Breakdowns generalists often compress. Demographic breakdowns by age and gender, plus placement performance across feeds, Stories, and Reels, let you see where budget is working. A multi-channel suite frequently leaves these at a summary level.
- Adaptive KPIs by goal. Lead-gen and e-commerce do not share a scorecard. A specialized dashboard can show cost per lead and lead volume for one account and ROAS and purchases for another, instead of forcing one fixed template.
- Fatigue signals in context. Frequency as a KPI, alongside period-over-period trends, helps you spot rising frequency next to a softening CTR, the pattern that usually precedes creative fatigue.
For a fuller list of what to watch, see the guide on Meta Ads KPIs to track. If you are weighing a dashboard against the platform’s own interface, Facebook Ads Manager vs a reporting dashboard covers that comparison directly.
Comparing on approach, not on invented numbers
Vendors change pricing and features often, so compare on how each type of tool is built and positioned, then check each vendor’s current pricing page for exact figures.
| Consideration | Cross-channel suite | Meta-only dashboard |
|---|---|---|
| Primary design goal | Blend many ad and marketing channels into one view | Report one platform, Meta, in depth |
| Per-channel KPI depth | Often summarized to a shared schema | Full native Meta KPIs and formulas |
| Demographic and placement detail | Sometimes limited | Age, gender, and placement breakdowns |
| Lead-gen vs e-commerce KPIs | Usually one fixed layout | Adaptive by account goal |
| Pricing basis | Often per channel or per data source | Can be per ad account |
| What you pay for | Connectors across many platforms | Depth on the channel you run |
A few notes on reading this fairly. A cross-channel suite is not worse, it is built for a different job: if you truly run several channels at scale, that blending is the point. And a Meta-only tool is not automatically cheaper for everyone, since cost depends on how many ad accounts you manage. The honest test is whether the breadth you would pay for maps to spend you actually run.
Reporting and client delivery do not require breadth
A frequent assumption is that only a big suite can produce polished, shareable reports. That is not the case. Specialized tools can still cover the full delivery workflow.
- Native exports. PDF, Excel, and CSV exports built in, so a report leaves the tool in the format a stakeholder expects.
- Scheduled and shareable. Scheduled email digests, public read-only share links, and a simplified client portal mean recipients see current numbers without a login wall.
- White-label tiers. White-label client reports let agencies and freelancers brand the output. If client-facing reporting is central to your work, the walkthrough on white-label client reporting goes deeper.
- Alerts and audit. Slack and Discord alerts plus audit logs keep a team informed and accountable without a separate tool.
Depth on Meta and clean client delivery are not a trade-off. You can have both from a tool that does one channel well.
A quick way to decide
Run through three questions in order, and stop at the first clear answer.
- Is Meta most of my spend? If yes, a dedicated dashboard almost always wins on depth and value. If no, keep going.
- Do my other channels need to sit in the same report? If they can be reported separately, you may still prefer the Meta-focused tool for its detail. If they must be blended, lean toward a suite.
- Am I paying for connectors I open? If a suite’s extra channels sit unused month after month, that is breadth you are funding without return.
One caution on attribution: no reporting tool removes the undercounting that iOS and the App Tracking Transparency prompt introduce on Meta. A good Meta dashboard reports Meta-native numbers honestly rather than inventing a blended figure to paper over the gap, which keeps your reports defensible.
DashOps is built for the mostly-Meta case: a Meta-specialized dashboard with 17 or more KPIs, demographic and placement breakdowns, adaptive lead-gen and e-commerce views, period-over-period comparison, multi-account management, native PDF, Excel, and CSV exports, and white-label client reporting, priced per ad account so you pay for the depth you use. See what each plan includes on the pricing page, and the help center covers connecting your first Meta ad account.
The takeaway: count your channels before you buy, and let your real spend mix, not a long feature list, decide between breadth and depth.
Frequently asked questions
When does a cross-channel suite make more sense than a Meta-only dashboard?
Does a Meta-only dashboard report the same numbers as Ads Manager?
Can a Meta-focused tool still produce client-ready reports?
See it in your own dashboard
DashOps brings Meta Ads reporting, campaign management, and white-label client portals into one place. Pick the plan that fits how you run ads.