The Best Facebook Ads Dashboard for Small Business Owners in 2026
A good Facebook Ads dashboard for small business answers one question fast: is the money working, and what changed since last period. You do not need agency-grade tooling to get that. You need the KPIs tied to your goal, a clear period-over-period comparison, and a clean way to share the result. Below is what a solo owner or small team actually needs from a Meta Ads reporting tool, and how to judge any option you try.
Start with the KPIs tied to your goal
You do not need every number Meta returns. You need the handful that tell you whether spend is paying off. A simple Facebook Ads dashboard should surface these without setup work.
- Spend and results, side by side. What you put in and what you got back, in the same view.
- Efficiency. Cost per result, whether that is cost per lead or cost per purchase. Cost per lead = spend / leads.
- Return. ROAS for sales, or pipeline value for lead gen. ROAS = conversion value / spend.
- Reach and CTR for early signals. CTR = clicks / impressions tells you whether the creative is landing before you spend more.
A capable tool covers more than four numbers. DashOps reads 17 plus Meta KPIs including spend, impressions, reach, clicks, CPC, CPM, CTR, ROAS, purchases, leads, and cost per lead, so you are not piecing the picture together from separate exports.
Show the trend, not just the total
A single number hides the story. Knowing you spent a certain amount this month means little until you see it against last month. Period-over-period comparison is the feature that turns a wall of figures into a decision.
This matters most for small businesses because your budget has less room to absorb a bad week. If CPM is climbing or CTR is sliding compared to the prior period, you want to catch it early, not at the end of the month. For a deeper look at which numbers to watch, our guide to Meta Ads KPIs to track walks through each one.
Judge what is good against your own goals, not a benchmark
It is tempting to ask whether your CTR or ROAS is good in the abstract. The honest answer is that it depends on your margin and your goal. A break-even ROAS for one business is a loss for another.
- Use your margin. Break-even ROAS = 1 / profit margin. That number tells you the floor your campaigns need to clear.
- Use your prior period. Compare this month to last month and to the same month last year if you have it. Direction matters more than any single reading.
- Use your own cost per result. Decide what a lead or a sale is worth to you, then judge spend against it.
A dashboard that shows trends lets you make those calls with your own context instead of guessing.
Keep the breakdowns simple but present
You will outgrow a single top-line view. The next layer is understanding where results come from, which helps you cut waste without a spreadsheet.
- Demographic breakdowns. Age and gender splits show which audiences respond, so you can shift budget toward what works.
- Placement breakdowns. Seeing Facebook versus Instagram performance side by side helps you spot where spend is efficient.
- Top campaigns and spend pacing. A quick view of which campaigns lead and whether you are on track to hit your budget keeps surprises out of the month.
Frequency as a KPI alongside reach and impressions also helps you notice fatigue: when the same people see an ad too often, performance tends to soften, and the trend will show it.
Adapt to whether you sell or generate leads
Small businesses split roughly into two camps, and the metrics that matter differ. A dashboard built for one and bolted onto the other gets noisy.
- E-commerce. You care about purchases, ROAS, and cost per purchase. The headline is revenue against spend.
- Lead gen. You care about leads, cost per lead, and lead volume trends. The headline is pipeline, not immediate sales.
DashOps adapts its KPIs to your case, so a lead-gen owner sees cost per lead front and center while an e-commerce owner sees ROAS. If you run Meta Instant Forms, leads flow into the dashboard and export to CSV or Excel. That export window matters: Meta only lets you download Instant Form leads directly from the Page for a limited time, about 90 days, after which leads must be retrieved through the API or a connected tool, so pulling them into a dashboard protects against losing them.
Make reporting and sharing painless
If you report to a partner, a co-owner, or yourself at month end, the export should take seconds. This is where a dashboard earns its keep over manual work.
- PDF, Excel, and CSV exports for whatever format the reader expects.
- Scheduled email digests so a summary lands without you opening anything.
- Public read-only share links when you want someone to see the numbers without an account.
- Slack and Discord alerts if you want a heads-up when spend spikes or performance shifts.
For the difference between live links and emailed summaries, see Ads Manager versus a reporting dashboard. If you ever report on behalf of a client, white-label options let you put your own brand on the output, covered in our white-label client reporting guide.
Match the tool to a small business budget
The right tool for a small business does not carry agency overhead you will never use. Look for view-only reporting if that is all you need, with the option to add campaign create and edit later if you grow.
DashOps does exactly this: a Starter plan is view-only reporting, while Growth and Enterprise add the full Meta module including campaign creation and editing. Pricing is per ad account, so you pay for what you connect. See what each plan includes on the pricing page, and the help center covers connecting your Meta account and reading your first report.
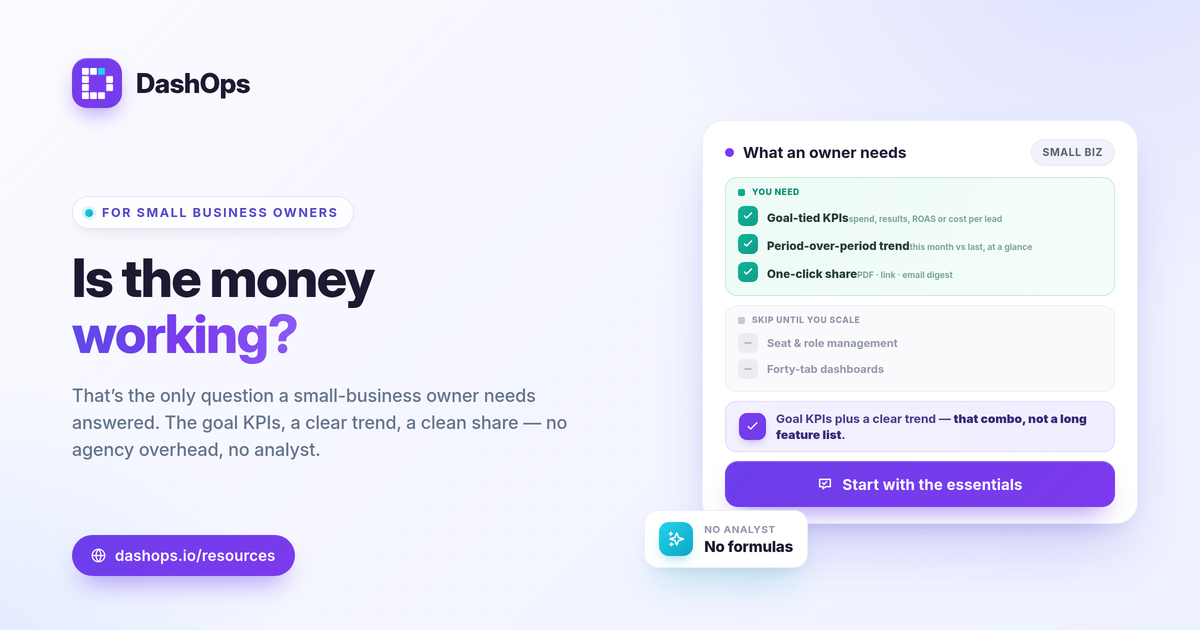
The takeaway: pick the dashboard that shows your goal-tied KPIs and a clear period-over-period trend, because that combination, not a long feature list, is what tells a small business owner whether the money is working.
Frequently asked questions
Do I need a dashboard if I only run a few Facebook Ads campaigns?
What is the difference between Ads Manager and a Facebook Ads dashboard?
Can a small business owner use a Facebook Ads dashboard without technical skills?
See it in your own dashboard
DashOps brings Meta Ads reporting, campaign management, and white-label client portals into one place. Pick the plan that fits how you run ads.