How to Track Lead Volume Trends in Facebook Ads Week Over Week
Watching lead volume week over week is the difference between catching a slowdown while you can still fix it and discovering it on the first of the month when it is too late. To track Facebook lead volume trends, you compare lead counts across consecutive weeks in a reporting view that puts this week next to last week, alongside spend and cost per lead, so a drop stands out immediately. The goal is not a prettier report. It is an early warning system. A weekly cadence smooths out daily noise without hiding a real decline, and pairing volume with spend tells you whether fewer leads mean a delivery problem or simply a smaller budget.
Why weekly, not daily or monthly
Daily lead counts are noisy. Weekends, ad approval delays, and normal delivery swings make any single day a poor signal, and reacting to one slow day usually means overcorrecting. Monthly reporting has the opposite problem: by the time the month closes, a three-week slide is already baked in and there is nothing left to do but explain it.
Weekly lead volume reporting for Meta ads sits in the middle. Seven days is enough to average out the day-to-day variance, and short enough that you still have runway to adjust budgets, refresh creative, or pause a fading ad set before the period is lost.
- Daily: too much noise, easy to overreact.
- Weekly: stable enough to trust, fast enough to act on.
- Monthly: good for the wrap-up, too slow to catch a live problem.
What to put in a weekly lead trend view
A weekly lead trend Facebook view should answer one question at a glance: are we getting more or fewer leads than last week, and is that good or bad. Keep it to the metrics tied to the goal.
- Lead volume. Total leads this week next to last week, and ideally the same week earlier in the month.
- Spend. What you spent over the same window, so volume changes have context.
- Cost per lead. Cost per lead = spend / leads. This is the metric that tells you whether a volume change is efficient or expensive.
- Period-over-period change. The direction and size of the move, not just the raw totals.
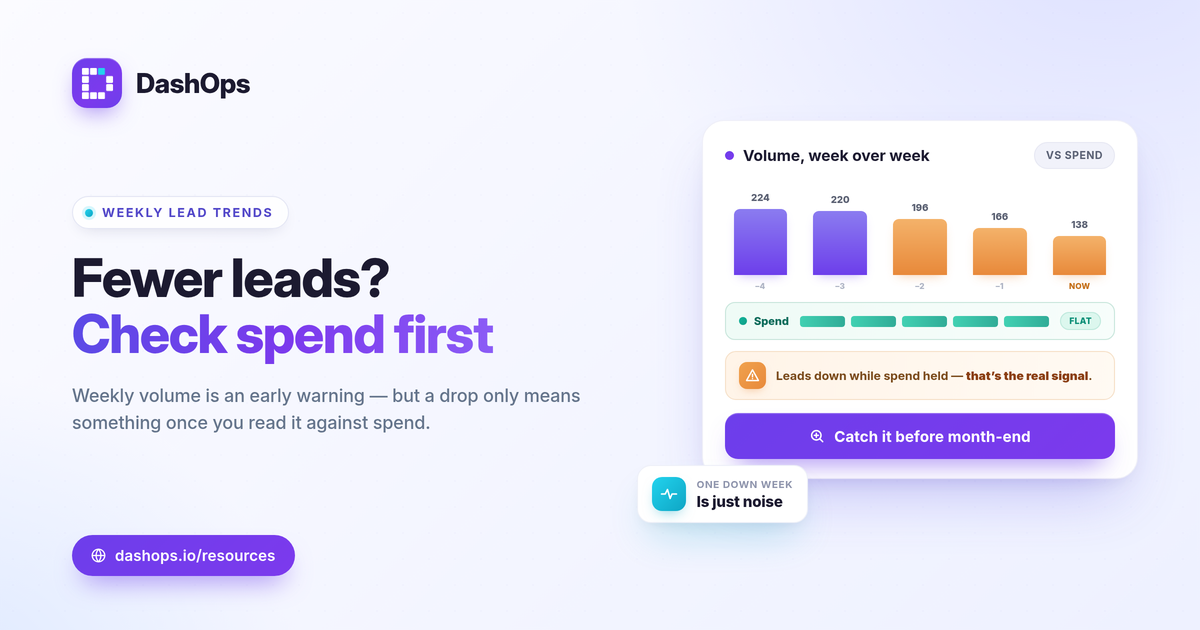
Volume without spend is misleading. Fewer leads on a smaller budget can mean your cost per lead held perfectly steady, which is a non-event. Fewer leads on the same budget is the signal you actually care about. For more on which metrics belong in any Meta report, see Meta ads KPIs to track.
Read the trend, not the single number
One week in isolation tells you almost nothing. A lead-gen trend dashboard earns its keep by showing the shape of the line over several weeks. A single down week inside a steady run is usually variance. Three down weeks in a row is a trend, and that distinction changes what you do next.
When you look at a weekly comparison, work through it in order:
- Did volume move? Compare this week to last week and to the same week earlier in the period.
- Did spend move with it? If spend dropped too, the volume change may be entirely expected.
- Did cost per lead change? Rising cost per lead at flat volume is a quiet efficiency problem worth catching early.
- Is the direction consistent? Two or three weeks pointing the same way matters far more than one outlier.
What a drop in lead volume is usually telling you
When weekly volume falls while spend holds, a few causes account for most cases. You will not diagnose every one from the trend line alone, but the trend tells you where to look.
- Budget or delivery changes. A paused ad set, a learning phase reset after an edit, or a budget that quietly got trimmed.
- Creative fatigue. As the same audience sees an ad repeatedly, response softens. Rising frequency alongside falling leads is the classic pattern, and frequency is a KPI you can watch directly. The demographic and placement breakdowns help you see whether the fatigue is concentrated in one segment.
- Audience or competition shifts. Costs rise, the same budget buys fewer results, and volume slips even though nothing in your account changed.
- Seasonality. Some weeks are simply slower, which is exactly why comparing to the same week in a prior period beats comparing only to last week.
The trend does not hand you the cause, but it points you at the right ad set or audience to inspect before a slow week becomes a slow month.
Mind the gap between reported and real leads
Two things keep your in-platform lead count from perfectly matching what lands in your CRM. iOS privacy changes cause Meta to undercount some conversions, so the reported figure can run a little low. And Instant Forms volume tracking has a hard constraint worth knowing: Meta only lets you download Instant Form leads directly from the Page for about 90 days, after which leads must be retrieved through the API or a connected tool.
For trend watching this mostly means two things. Use a consistent source week to week so you are comparing like with like, and do not let leads age past the download window if you rely on manual exports. Pulling leads on a steady schedule into one place avoids the gaps that make a trend line jump for no real reason.
Make the weekly check a habit
A trend is only useful if someone looks at it on a regular rhythm. The advertisers who catch drops early are the ones who glance at the same weekly view every Monday, not the ones who build a fresh report each month. If you manage several accounts, doing this by hand in Ads Manager gets slow, which is part of why a dedicated view beats the native interface for recurring reporting. The comparison in Ads Manager vs a reporting dashboard covers that tradeoff in more detail.
DashOps shows lead volume with period-over-period comparison and trend charts across every connected Meta ad account in one dashboard, with adaptive lead-gen KPIs like cost per lead, plus Instant Forms lead capture and CSV or Excel export so older leads do not slip past the 90-day window. Scheduled email digests can put the weekly trend in your inbox automatically, and white-label client reports keep clients in the loop. See what each plan includes on the pricing page, and the help center covers connecting an account and setting up digests.
The practical takeaway: compare lead volume against last week and against spend every week, and a slow month stops being a surprise.
Frequently asked questions
How often should I check lead volume trends in Facebook Ads?
Why does my lead count differ between Facebook and my CRM?
What counts as a meaningful drop in weekly lead volume?
See it in your own dashboard
DashOps brings Meta Ads reporting, campaign management, and white-label client portals into one place. Pick the plan that fits how you run ads.