Meta Ads Dashboard for Lead Gen Businesses: Tracking Leads and Cost Per Lead in One View
A Meta Ads dashboard for lead gen has one job: put leads, cost per lead, and the form data behind them where you can see them in one glance. If you run lead generation campaigns, the metrics that decide whether the money worked are different from an e-commerce store, so a dashboard built around purchases and ROAS shows you the wrong story. The fix is a view that leads with lead volume and cost per lead, splits web leads from Instant Form leads, and adapts its KPIs to the lead-gen objective automatically. Below is what that view should contain and why it changes how you read performance.
Why lead gen needs its own dashboard
E-commerce reporting revolves around revenue: purchases, return on ad spend, average order value. Lead generation has no purchase event at the ad level. Your result is a form fill, a phone call, or a message, and its value shows up later in your pipeline, not in Meta. A standard dashboard that puts ROAS in the hero spot leaves a lead-gen advertiser staring at a metric that often reads as zero or blank.
The numbers that actually tell a lead-gen advertiser whether things are working are simpler:
- Lead volume. How many leads the spend produced in the period.
- Cost per lead. The efficiency number that decides if the channel is sustainable.
- Spend. What it cost to get there.
- Lead trend. Whether this period beat the last one, which is the real question.
Everything else is supporting detail. A good lead gen Facebook Ads dashboard treats those four as the headline and keeps the e-commerce metrics out of the way.
Cost per lead is the number to lead with
Cost per lead is the single figure most lead-gen advertisers check first, so a cost per lead dashboard should make it impossible to miss. The formula is straightforward:
- Cost per lead = spend / leads
That gives you the average cost to acquire one lead in the period. On its own a CPL is just a number. What makes it useful is context, and there are three honest ways to judge it without inventing a benchmark:
- Against your own goal. You know what a lead is worth to your business once it closes. Your target CPL falls out of your close rate and your margin, not out of an industry average.
- Against your prior period. A period-over-period comparison tells you if CPL is climbing or falling, which matters more than the absolute number on any single day.
- Against your lead quality. A low CPL on leads that never convert is a worse outcome than a higher CPL on leads that do. Cost per lead and lead quality are two different questions, and the dashboard should never let the first hide the second.
Be wary of anyone quoting a universal “good” cost per lead. What counts as good depends on your offer, your margin, and your follow-up. The dashboard’s job is to show CPL clearly and trend it, then let your own numbers set the bar.
Put Instant Forms data front and center
Many lead-gen advertisers collect leads through Meta Instant Forms, the native form that opens inside Facebook or Instagram without sending the user to a landing page. An Instant Forms dashboard should show, per form, how many leads it captured, which campaigns feed it, and let you pull the actual lead records out.
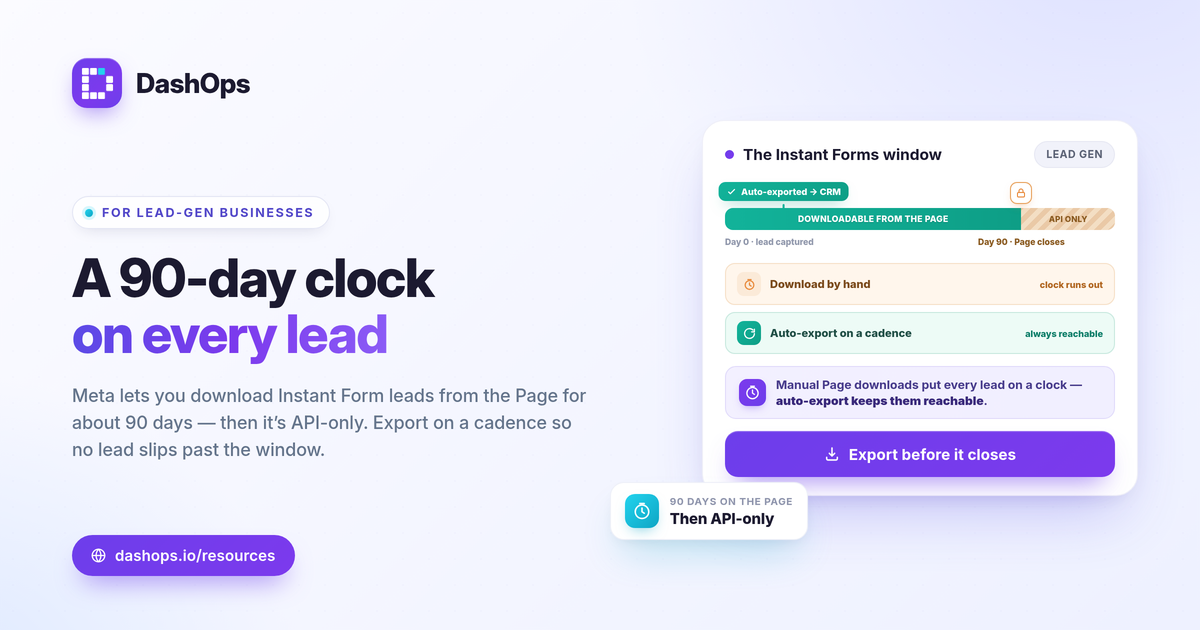
That export matters for a practical reason worth stating plainly: Meta only lets you download Instant Form leads directly from the Page for a limited window, about 90 days. After that, leads have to be retrieved through the API or a connected reporting tool. If you rely on manually downloading them from the Page, you have a ticking clock on every lead. A dashboard that captures and exports leads on a regular cadence removes that risk and keeps the records reachable for your CRM or follow-up process.
A lead reporting tool earns its place here by doing three things:
- Counting leads per form so you see which forms produce volume.
- Splitting web leads from Instant Form leads so you know where leads come from.
- Exporting to CSV or Excel so the data flows into wherever you actually work the leads.
How an adaptive dashboard switches to lead-gen KPIs
The most useful behavior in a Meta Ads dashboard for lead gen is one you should not have to configure. An adaptive dashboard looks at the objective mix of your campaigns and chooses the KPIs to match. When your account is running lead generation, it shows leads, cost per lead, and spend instead of purchases and ROAS. When you also run sales campaigns, it shows both sets side by side. You never toggle a “lead-gen mode” switch.
This adaptation should carry through the whole view, not just the top cards:
- The KPI grid swaps purchase and ROAS cards for leads, cost per lead, and spend cards.
- The trend chart plots spend against leads rather than spend against purchases.
- The breakdowns report cost per lead by age, gender, and placement, so you can see which audiences and placements produce affordable leads.
- The report exports carry the same lead-gen columns into PDF, Excel, and CSV.
The point is that the dashboard meets the campaign where it is. For more on how the underlying metrics fit together, the 17 Meta Ads KPIs every advertiser should track walks through the full set, and ROAS vs CPL vs CPA explained covers when each efficiency metric is the right one to lead with.
Reading the lead-gen view in practice
Open the dashboard and you should be able to answer “did the money work” in a few seconds. For a demo account like Northwind Solar running lead campaigns, the read is: spend for the period, leads captured, cost per lead, and whether CPL beat last period. From there you drill: which form drove the most leads, which placement delivered the cheapest leads, which age and gender segment converts at a price you can live with.
Watch frequency and the trend together when CPL starts creeping up. Rising frequency on a steady audience often precedes a climbing cost per lead, and the period-over-period comparison plus the demographic and placement breakdowns are usually enough to spot fatigue before it gets expensive. None of that requires a separate tool, just a dashboard that surfaces the lead-gen signals by default.
If you manage Meta Ads for a lead-gen business, or across several of them, DashOps reads every lead-gen KPI in one place, adapts the KPIs to your objective automatically, and exports your Instant Form leads to CSV or Excel before Meta’s retention window closes. See what each plan includes on the pricing page, and the help center covers connecting your ad accounts and setting up reports.
The practical takeaway: build your lead-gen reporting around lead volume and cost per lead, judged against your own goals and your prior period, and make sure your Instant Form leads are exported before the 90-day window runs out.
Frequently asked questions
What metrics should a lead gen Meta Ads dashboard show first?
How is an adaptive lead gen dashboard different from a standard one?
Can I export Instant Form leads from the dashboard?
See it in your own dashboard
DashOps brings Meta Ads reporting, campaign management, and white-label client portals into one place. Pick the plan that fits how you run ads.