How to Build an E-commerce Facebook Ads Report Focused on ROAS
An e-commerce Facebook Ads report exists to answer one question for an online store: did the ad spend turn into profitable sales. The metric that carries that answer is ROAS, supported by purchases, conversion value and cost per purchase. A strong ecommerce Meta Ads report leads with those sales numbers, shows them against the prior period, and only then drops into the efficiency metrics that explain the result. This guide walks through that structure step by step, and shows where DashOps does the ROAS math for you so the report stays accurate and fast to produce.
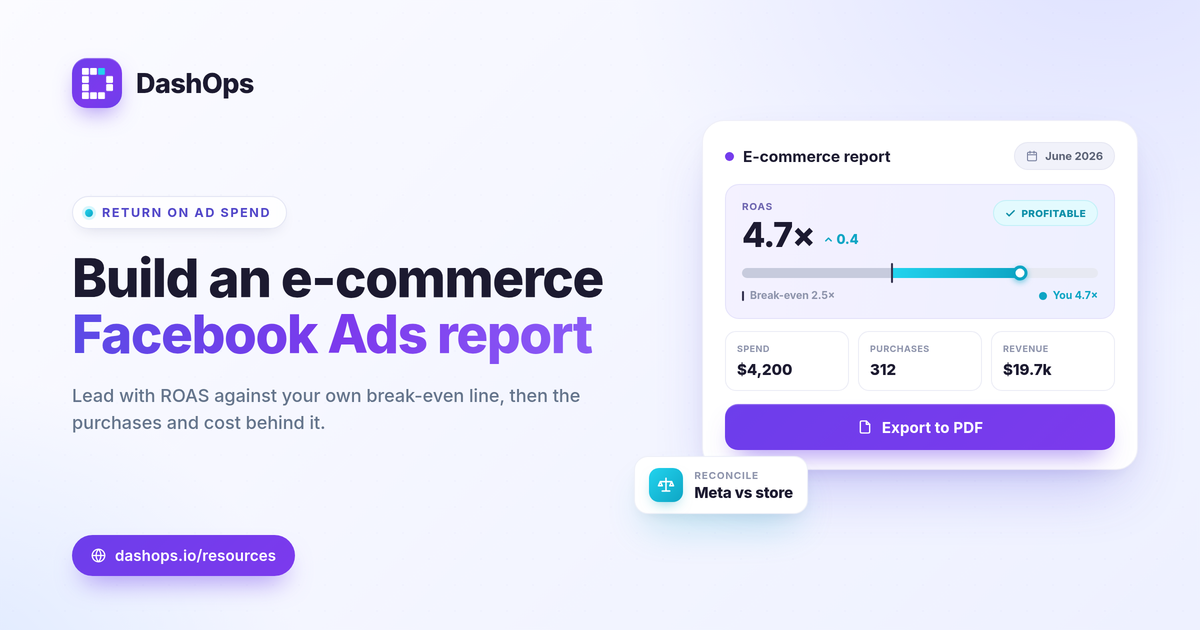
Start with the four numbers that decide everything
Open your e-commerce Facebook Ads report with the metrics tied directly to revenue. Everything else is supporting detail.
- Spend. What you put into Meta over the period.
- Purchases. The number of purchase events Meta attributed to your ads.
- Purchase conversion value. The revenue Meta tied to those purchases.
- ROAS. Conversion value divided by spend.
These four tell the whole story in one glance. If you want one number to anchor the report, make it ROAS, because it folds spend and return into a single ratio. DashOps surfaces these as adaptive e-commerce KPIs, so when an account is selling products the dashboard puts purchases, conversion value and ROAS front and centre rather than burying them.
Make ROAS mean something with a break-even line
A ROAS report for Facebook Ads is only useful if the reader knows what counts as good. Resist the urge to cite a universal benchmark, because the right target depends on your margins, not on an industry average.
The honest way to frame it is your break-even ROAS:
- Break-even ROAS = 1 / profit margin. Plug in your own margin to find the line you need to clear just to cover product cost. A higher margin pushes that break-even line lower, a thinner margin pushes it higher, so the target is specific to your store rather than a number you borrow from someone else.
- Compare actual ROAS to that line. Above it you are profitable on ad spend, below it you are buying revenue at a loss.
- Compare to last period too. A ROAS that is healthy but falling deserves a note, and one that is climbing deserves a callout.
This is what separates a number from an insight. The reader does not want to know ROAS was a certain figure, they want to know whether it cleared the bar and which way it is trending.
Add the efficiency layer that explains the result
Once the sales numbers are stated, bring in the metrics that explain how you got there. These are diagnostic, not headline.
- Cost per purchase. Spend divided by purchases. This is your acquisition cost and the cleanest efficiency signal for e-commerce.
- CTR. Clicks divided by impressions, a read on whether the creative is earning attention.
- CPC. Spend divided by clicks, the price of getting someone to the site.
- CPM. Spend divided by impressions times 1000, the cost of reaching the audience.
Read these as a chain. If ROAS dropped, walk back through it: did cost per purchase rise, was that driven by a worse CTR or a higher CPM, and did frequency climb at the same time. For a deeper tour of which signals matter and how they connect, see the Meta Ads KPIs worth tracking.
Show the trend, not just the total
A single total hides the story. Purchase reporting in Meta Ads becomes far more useful when each figure sits next to the prior period.
- Period-over-period comparison. This month against last, or this week against last, so spend, purchases and ROAS each carry a direction.
- Trend charts. A line for spend against a line for purchases shows whether more budget actually bought more sales or just more cost.
- Spend pacing. Whether you are on track to hit the budget you planned, which matters when a campaign is scaling.
DashOps builds the period-over-period comparison into every KPI, so the report shows the change automatically instead of you exporting two date ranges and subtracting by hand.
Break down where the returns come from
Totals tell you what happened. Breakdowns tell you why, and where to act next.
- Demographics. Age and gender breakdowns show which segments drive purchases and which only spend. A segment with high spend and few purchases is dragging your overall ROAS down.
- Placements. Feed, Reels, Stories and the rest rarely perform identically. Splitting purchases and cost per purchase by placement shows where the efficient sales are coming from.
- Top campaigns. Rank campaigns by spend and ROAS so the report makes the winners and the laggards obvious.
These views also help you read ad fatigue. If frequency is rising in a segment while its ROAS slips period over period, that audience is seeing the same ads too often, and the breakdown is where you catch it.
Reconcile Meta’s purchases with your store
E-commerce reporting has one trap worth naming directly. Meta’s attributed purchases often undercount real sales because iOS App Tracking Transparency limits what Meta can see. The figure in Ads Manager is the in-platform view, not your full sales ledger.
The clean way to handle this in a report is to show both, clearly labeled:
- Meta-reported purchases and ROAS. The numbers as the platform attributes them.
- Your store’s actual sales. From your e-commerce analytics, for context.
Do not blend the two into one figure or imply Meta’s number is your total revenue. Labeling each keeps the report trustworthy. If your Ads Manager and your reports ever seem to disagree, this explainer on mismatched numbers covers why that happens.
Make it repeatable
A report you rebuild from scratch every month is a report you eventually skip. The goal is the same clean structure, produced the same way, every period.
- Lock the metric order: spend, purchases, conversion value, ROAS, then the efficiency layer.
- Keep the same date comparison logic each time.
- Export in the format the reader wants, whether that is a PDF for a stakeholder or a CSV for your own records.
DashOps pulls every one of these KPIs across your Meta ad accounts into one dashboard with period-over-period comparison and the e-commerce math already done, then exports to PDF, Excel or CSV when you need to send it on. See what each plan includes on the pricing page, and the help center walks through connecting an account and building your first report.
The takeaway: lead with ROAS measured against your own break-even line, support it with purchases and cost per purchase, and reconcile against your store so the report tells the truth about whether the spend worked.
Frequently asked questions
Which metrics belong in an e-commerce Facebook Ads report?
How do I calculate ROAS for a Facebook Ads report?
Why do Meta purchase numbers sometimes look lower than my store's sales?
See it in your own dashboard
DashOps brings Meta Ads reporting, campaign management, and white-label client portals into one place. Pick the plan that fits how you run ads.