What Is a Good ROAS for Facebook Ads by Industry in 2026?
A good ROAS for Facebook Ads is any return that clears your break-even point and leaves enough margin to hit your profit goal. There is no single universal number, and any chart claiming one average ROAS by industry is hiding how much it varies. Real benchmarks shift with your objective, audience, price point, season, and creative, which is why the honest answer to “what is a good ROAS” starts with your own math. Calculate your break-even ROAS, set a target above it, then judge each period against your own history. This guide shows how to do that and why comparing against yourself beats chasing a published number.
What ROAS actually measures
ROAS, return on ad spend, is the revenue your ads generated divided by what you spent on them.
- The formula: ROAS = conversion value / spend. If you spent on ads and Meta attributes a certain amount of purchase value to them, the ratio is your ROAS.
- What it does not include: ROAS is gross revenue against ad cost. It ignores cost of goods, shipping, payment fees, and overhead. A ROAS that looks strong can still lose money once those costs come out.
That gap is exactly why a single ecommerce ROAS benchmark is misleading. The same return reads very differently depending on margin: a ROAS that is comfortable for a high-margin digital product can be underwater for a low-margin reseller. The number only means something next to your margin.
Why there is no single good ROAS by industry
People search for average ROAS by industry hoping for one target to aim at. The problem is that the inputs moving ROAS are wildly different even inside the same industry.
- Profit margin. A high-margin product can thrive at a low ROAS. A thin-margin product needs a much higher one to survive.
- Objective. Prospecting cold audiences usually returns a lower ROAS than retargeting warm ones. Blending both into one number hides which is working.
- Price point and order value. Higher average order values change the arithmetic of what a profitable return looks like.
- Season and auction demand. Costs rise when more advertisers compete, which compresses ROAS even when your ads have not changed.
- Creative and audience fatigue. As frequency climbs and the same people see your ads repeatedly, response drops and ROAS slides.
Two businesses in the same category can post very different numbers and both be healthy. That is why a published Meta Ads ROAS benchmark is a starting reference at best, never a verdict on your account.
How to set your own ROAS target
Instead of borrowing a number, build the target from your own economics. This takes a few minutes and gives you a figure that actually applies.
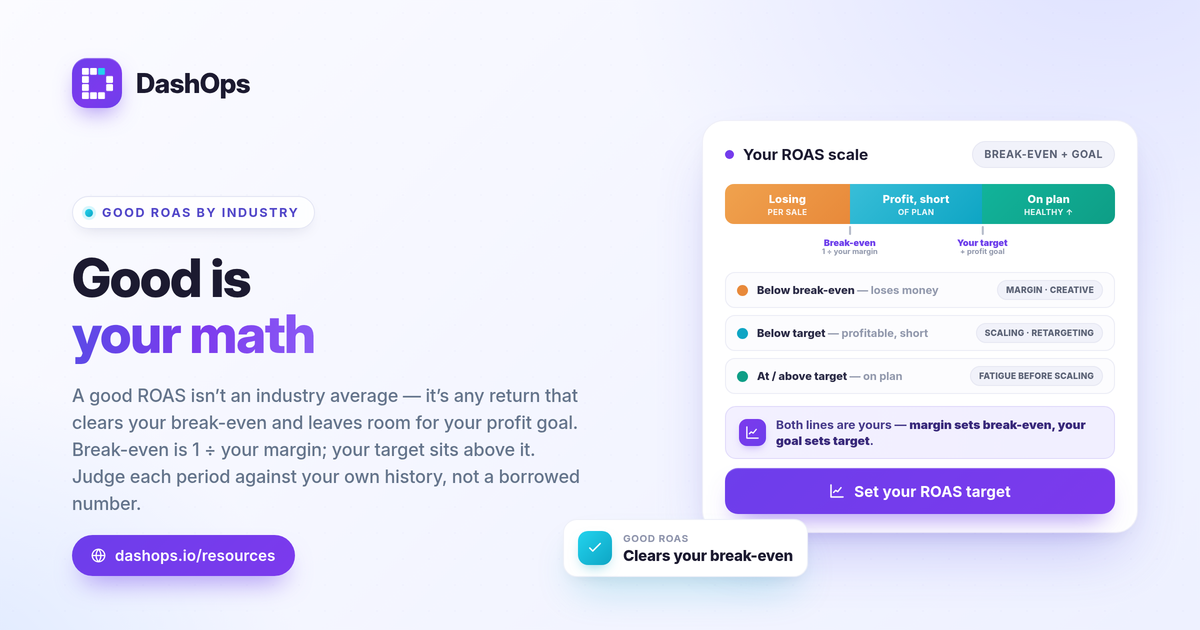
- Step one, find break-even ROAS. Break-even ROAS = 1 / profit margin. If your margin after costs is 40 percent, your break-even ROAS is 1 / 0.40, which is 2.5. Below that, every sale loses money.
- Step two, add your profit goal. Break-even keeps you flat. To grow, set the target above it. How far above depends on how aggressively you want to reinvest versus bank profit.
- Step three, check it against history. Pull your ROAS for the last several periods at similar spend. If your new target sits wildly outside what you have ever achieved, it may be a wish rather than a plan.
This is the calm version of benchmarking. You are measuring against a number you can defend, not a stranger’s spreadsheet.
Benchmark against yourself, period over period
The most reliable Meta Ads ROAS benchmark is your own prior performance. The question a client or a finance team actually asks is “did this period beat last period,” and only your own history answers it.
- Compare like with like. Match this month to last month, or this quarter to the same quarter last year, so seasonality does not distort the read.
- Hold spend roughly constant. ROAS often moves as you scale, so a fair comparison keeps the spend level similar or notes when it changed.
- Watch the trend, not one data point. A single low day means little. A three-period slide in ROAS is a signal worth investigating.
When you track ROAS this way, a number that would look bad against an invented industry average might actually be your best quarter yet, and you would know it.
Why your reported ROAS may understate reality
Before you judge a ROAS as poor, confirm the number is complete. Meta only counts conversions it can attribute, and that count is conservative.
- Attribution gaps. Meta credits purchases it can tie back to an ad through the pixel or the Conversions API. Sales it cannot connect are not in the ROAS.
- iOS and privacy changes. Since Apple’s tracking prompt limited signal, Meta tends to undercount conversions, which pushes reported ROAS below your true return.
- Reconcile with your real numbers. Compare Meta-attributed revenue against your store or CRM totals. If your actual sales are higher, your real ROAS is better than the dashboard shows.
For a deeper look at the metrics that surround ROAS and how they fit together, see our guide to the Meta Ads KPIs to track. If you sell products, our piece on what is a good ROAS for ecommerce Facebook ads goes further on margin-based targets.
A quick reference for judging your ROAS
| If your ROAS is | What it likely means | What to check |
|---|---|---|
| Below break-even | You are losing money per sale | Margin, audience targeting, creative |
| At break-even | Flat, no profit, no loss | Whether the goal is growth or volume |
| Above break-even, below your target | Profitable but short of plan | Scaling room, retargeting mix |
| At or above your target and trending up | Healthy, on plan | Frequency and fatigue before you scale harder |
Break-even comes straight from your margin, and the target comes from your profit goal, so this table reads off numbers you control rather than industry guesses.
Pulling ROAS, spend, and conversion value across your ad accounts into one view makes this comparison fast instead of a monthly spreadsheet chore. DashOps reads your Meta KPIs with period-over-period comparison built in, so benchmarking against your own history is the default rather than extra work, and white-label client reports present it cleanly when you report to others. See what each plan includes on the pricing page, and the help center walks through connecting an ad account.
The honest benchmark for a good ROAS is your break-even number plus your profit goal, measured against your own last period, not a borrowed industry average.
Frequently asked questions
What is a good ROAS for Facebook Ads?
Does average ROAS by industry tell me if my campaigns are healthy?
Why is my reported ROAS lower than my actual sales?
See it in your own dashboard
DashOps brings Meta Ads reporting, campaign management, and white-label client portals into one place. Pick the plan that fits how you run ads.