Facebook Ads CTR Benchmark by Industry: Average Click-Through Rates and How to Beat Them
There is no single Facebook Ads CTR benchmark that applies to your account, because real click-through rates vary widely by industry, objective, audience, placement and season. Anyone publishing one universal “average” number is hiding that variation. CTR is simply clicks divided by impressions, and what counts as a good rate depends on what you sell, who you target and what you are asking the click to do. The reliable way to benchmark is against your own history: track CTR over time, compare each period to the last, and use the trend to spot creative that is slipping. This guide covers the formula, what moves it, and how to read it honestly.
What CTR actually measures
Click-through rate is the share of people who saw your ad and clicked it. The formula is plain:
- CTR = clicks / impressions. Multiply by 100 for a percentage.
Meta reports more than one click figure, and the difference matters. “CTR (all)” counts every click, including likes, comments and profile taps. “CTR (link click-through rate)” counts only clicks to your destination. For performance reporting, the link version is the one tied to results, so make sure you know which one a number refers to before you compare it to anything.
CTR is an attention metric. It tells you whether the creative and audience pairing earned interest, not whether that interest converted. That is why average CTR Facebook Ads figures, on their own, never tell the full story.
Why an industry average CTR will mislead you
A “Facebook Ads CTR benchmark by industry” table looks useful, but it flattens the things that actually drive the number. Two accounts in the same industry can sit far apart for honest reasons:
- Objective. A reach or awareness campaign and a conversion campaign produce very different Meta Ads click-through rate patterns.
- Audience temperature. Retargeting a warm list almost always clicks higher than cold prospecting.
- Placement. Feed, Stories, Reels and the Audience Network each behave differently, so an Instagram CTR benchmark from one surface will not match another.
- Offer and creative. A sharp hook and a clear offer lift CTR regardless of industry.
- Season and auction. Demand spikes, holidays and more competitors in your auction all move the number.
Because all of these shift the result, a published median is a starting curiosity, not a target. The figure you should chase is not someone else’s average. It is a better version of your own last period.
How to judge whether your CTR is good
Skip the hunt for a universal number and ask three questions about your own account instead.
- Is it trending up, flat or down? Compare this period to the prior period for the same campaign and audience type. A falling CTR on a creative that used to perform is your earliest fatigue warning.
- Is the cost per result still acceptable? CTR only matters if the clicks lead somewhere. Read it next to cost per result, ROAS or cost per lead. A high CTR with weak conversions points to a message-to-offer mismatch.
- Is it consistent across comparable campaigns? If one campaign type clicks far below your others, that is the underperformer to investigate, not the industry table.
Good CTR by industry is really good CTR for your goals, your margin and your prior trend. That framing keeps you honest and points at action.
Use CTR to spot underperforming creative
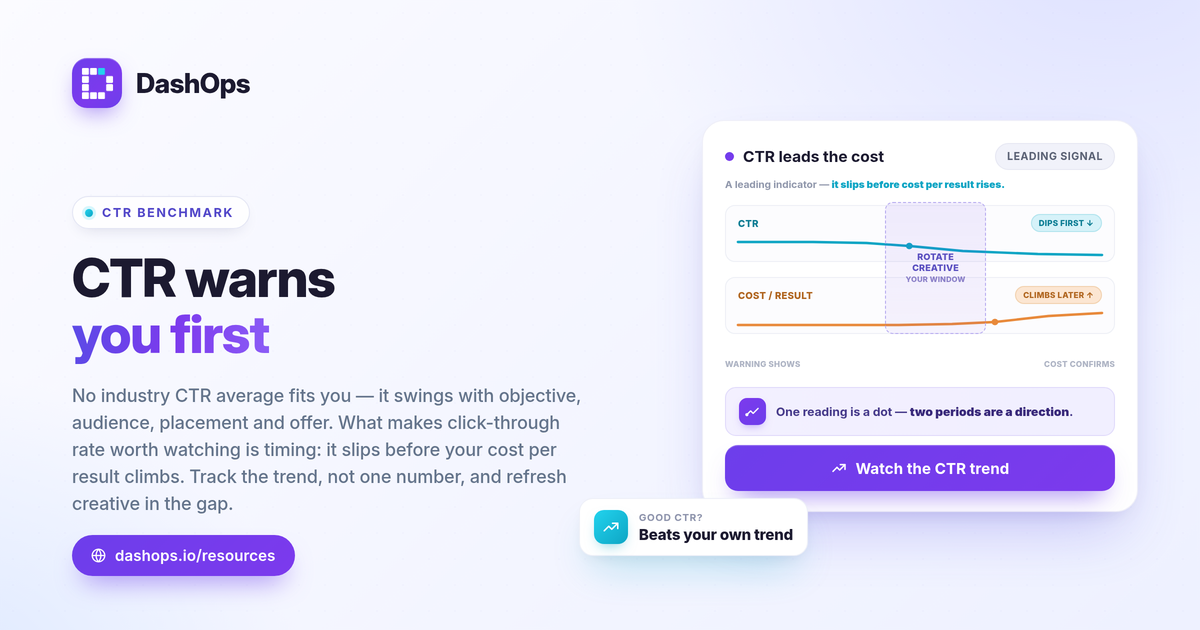
CTR earns its place as a leading indicator. Results data lags, but a drop in click-through rate often shows up first, before cost per result climbs. To use it that way, watch the trend rather than the snapshot.
- Track CTR period over period. A single number is a dot. Two periods are a direction. A clear downward slope on a previously strong ad usually means the audience has seen it too often.
- Pair it with frequency. When frequency rises and CTR falls together, that pattern is classic creative fatigue. Both are real KPIs you can watch, and reading them side by side tells you when to refresh the ad.
- Break CTR out by placement. A blended account CTR can hide a weak placement. Comparing Feed against Stories against Reels shows where attention is actually dropping.
- Compare demographics. An age or gender segment that clicks well below the rest may signal a targeting or creative mismatch worth fixing.
The goal is not to admire the number. It is to catch the slide early and rotate creative before efficiency erodes.
Track CTR alongside the metrics around it
CTR rarely tells the truth alone. CPM tells you what attention costs, CPC tells you what a click costs, and the result metrics tell you whether any of it paid off. Reading them together prevents the trap of celebrating a high CTR that produces nothing. For the wider set worth watching, see our guide to the Meta Ads KPIs to track, and if you want the deeper logic of self-benchmarking, how to benchmark Meta ads performance covers the same approach across every metric.
Native Ads Manager will show you CTR, but stitching the trend together period over period, by placement and by demographic, is where a reporting layer saves time. The difference between the two views is the subject of Facebook Ads Manager vs a reporting dashboard.
Where DashOps fits
DashOps reads CTR as one of 17 plus Meta KPIs across your ad accounts, with period-over-period comparison and trend charts built in, so judging your click-through rate against your own history takes a glance rather than a spreadsheet. Demographic and placement breakdowns sit alongside it, which makes spotting a weak segment or surface straightforward, and white-label client reports let you present the trend cleanly. See what each plan includes on the pricing page, and the help center walks through connecting an account.
The most reliable Facebook Ads CTR benchmark is the one you build from your own trend, so compare this period to the last and let the direction tell you when creative needs a refresh.
Frequently asked questions
What is a good CTR for Facebook Ads?
Why is my Facebook Ads CTR different from my Instagram CTR?
Does a high CTR always mean my ads are working?
See it in your own dashboard
DashOps brings Meta Ads reporting, campaign management, and white-label client portals into one place. Pick the plan that fits how you run ads.