Facebook Ads Benchmarks for Local Services: What Plumbers, Dentists and Trades Pay Per Lead
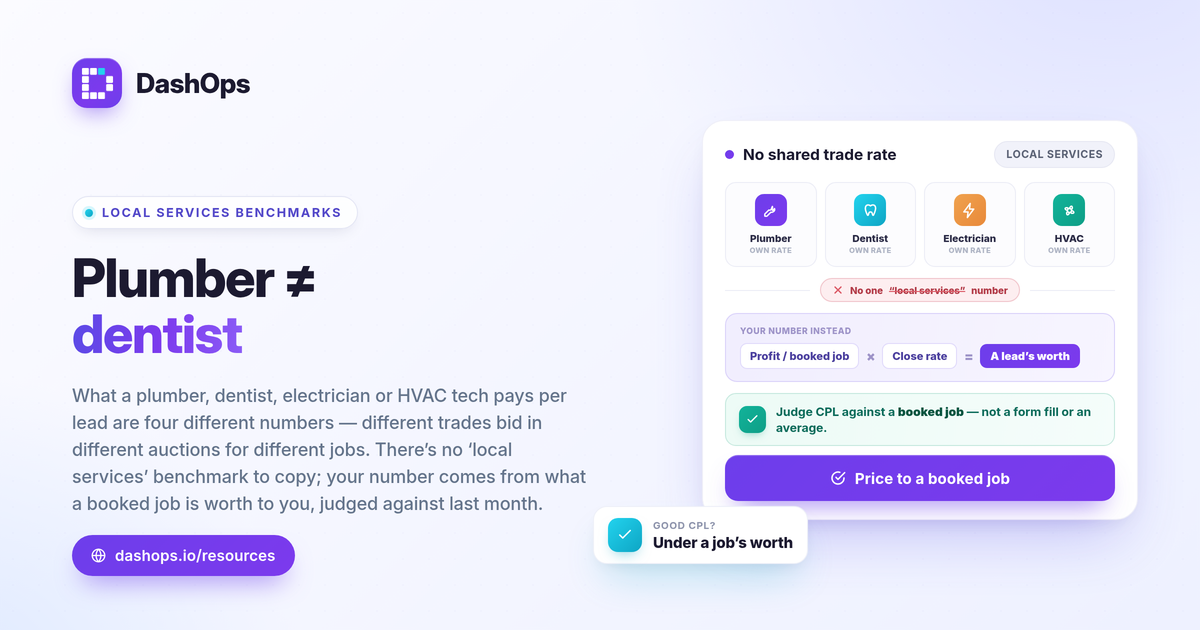
For local services, the honest answer to “what should I pay per lead on Facebook Ads” is: it depends on your trade, your market, your season, and your offer, so the number that matters is your own. Plumbers, dentists, electricians, HVAC techs and other trades all see very different costs because they bid in different auctions for different audiences. Published Facebook Ads benchmarks for local services vary so widely that copying one figure can mislead you badly. The reliable approach is to learn the formulas, understand what moves them, and judge your cost per lead against your job value and your prior months. This guide shows you how.
Why one universal local services benchmark does not exist
A “good” number for a dentist in a dense city and an electrician in a rural town are not the same number, and pretending otherwise leads to bad decisions. Local business Facebook Ads cost is driven by factors that differ for every advertiser.
- Auction demand. More advertisers chasing the same local audience pushes your cost per click and cost per result up.
- Audience and area. A tight radius around one suburb behaves differently from a whole metro region.
- Objective. A lead form, a phone call, and a website conversion are priced differently by Meta.
- Season. HVAC peaks in heat waves, tax help peaks in spring, and costs follow demand.
- Creative and offer. A clear offer (“free inspection this week”) usually beats a generic brand ad on cost per lead.
Because all of these vary, a single home services Meta Ads benchmark number you read somewhere is, at best, a loose anchor. Your own history is a far better yardstick.
The formulas that actually matter
You do not need a benchmark table to judge performance. You need three formulas and your own goals.
- Cost per lead. cost per lead = spend / leads. This is the headline number for lead-gen trades.
- CPC (cost per click). CPC = spend / clicks. A rising CPC usually signals more auction competition or audience fatigue.
- CPM (cost per 1,000 impressions). CPM = spend / impressions times 1000. Useful for spotting when your market is simply getting more expensive to reach.
For the trades cost per lead question, cost per lead is the one to watch, with CPC and CPM as the supporting detail that explains why it moved. If you want a deeper breakdown of the lead metric itself, see calculate cost per lead facebook ads.
How to judge “good” against your own numbers
Instead of asking “is my cost per lead below the industry average,” ask “is my cost per lead below what a lead is worth to me.” That is the question that protects your margin.
- Work out your break-even. Take your average profit per booked job and multiply it by your close rate, the share of leads that turn into paying work. That gives you roughly what one lead is worth to you, so a cost per lead comfortably under that figure is healthy and one above it is eating your margin.
- Tie it to a real outcome. A cheap lead that never books is worse than a pricier lead that turns into a job. Track booked work, not just form fills, where you can.
- Watch the prior-period trend. Whether this month beat last month tells you more than any external figure. If cost per lead is falling and lead volume is steady or rising, you are winning regardless of what a benchmark says.
This is exactly why period-over-period comparison beats chasing a single universal number: it benchmarks you against yourself, which is the only fair comparison.
Reading CPC and CPM the same way
CPC and CPM follow the same logic. There is no magic “good” cost per click for trades, because dense markets, premium trades and peak seasons all push it up legitimately.
- A higher CPC is not automatically bad. If those clicks convert into cheaper leads or higher-value bookings, paying more per click can still be the right trade.
- A rising CPM often means competition or saturation. If you have shown the same creative to the same small local audience for weeks, frequency climbs and CPM with it. A creative refresh or a wider radius often resets it.
- Compare to your own baseline. Your CPC last quarter is a more useful reference than a stranger’s quoted average. For context on the cost-per-click metric, see facebook ads cpc benchmark.
A simple monthly check for local trades
You can run a clean monthly review in a few minutes if you focus on the goal-tied numbers and the trend.
- Spend and leads. What you spent and how many leads it produced, side by side.
- Cost per lead, this month vs last. The single most important comparison for a local lead-gen business.
- CPC and CPM trend. So you can explain why cost per lead moved, not just that it moved.
- Lead quality, where you can measure it. How many leads became booked jobs, so you are optimising for revenue and not just volume.
If you run more than one location or ad account, pulling all of this into one place saves real time. DashOps reads every Meta KPI across your ad accounts, including cost per lead, CPC and CPM, in a single dashboard with period-over-period comparison built in, and it captures Meta Instant Form leads so you can judge volume and export them. See what each plan includes on the pricing page, and the help center covers setup.
The practical takeaway: stop hunting for one universal Facebook Ads benchmark for local services and start measuring this month against last month and against what a booked job is worth to you.
Frequently asked questions
What is a good cost per lead for local services on Facebook Ads?
Why is my CPC higher than other local businesses I have read about?
How do I know if my local services Facebook Ads are actually working?
See it in your own dashboard
DashOps brings Meta Ads reporting, campaign management, and white-label client portals into one place. Pick the plan that fits how you run ads.