Facebook Ads CPC Benchmark by Industry: Average Cost Per Click and What Drives It
A Facebook Ads CPC benchmark sounds like it should be a single number you can chase, but the honest answer is that there is no universal one. Cost per click on Meta swings widely by industry, campaign objective, audience, season, and creative, so a figure that is cheap for one advertiser is expensive for another. The useful move is not to find a magic average. It is to learn the real formula, understand the levers that push CPC up or down, and judge your own cost per click against your goals and your own prior periods. This guide walks through all three.
What CPC actually measures
CPC is the average cost you pay for one click. The formula is simple:
- CPC = total spend / total clicks
The detail that trips people up is which click you are counting. Meta reports more than one click metric:
- Cost per link click. Counts only clicks that send someone to your destination. This is the average cost per click Facebook advertisers usually mean, and the one to use for traffic and conversion work.
- Cost per click (all). A broader figure that also counts reactions, comments, shares, and post expands. It looks lower because the denominator is bigger, but those extra clicks rarely lead anywhere.
When you compare your CPC to anything, make sure both numbers measure the same click type. Always compute it from period totals, not by averaging a column of daily CPC values, or short, cheap days will distort the result.
Why a single Meta CPC by industry figure misleads
It is tempting to look up an “average cost per click Facebook” table and treat the row for your vertical as a target. Two problems make that risky.
- The ranges are huge. Real benchmarks vary widely by industry, objective, audience, and season. A lead-gen account in a low-competition niche and an e-commerce brand bidding against thousands of others in Q4 can sit at completely different CPCs and both be doing fine.
- The number is a moving target. Meta runs a live auction. The same audience can cost more this week than last because demand changed, not because your ads got worse. A static published average can be out of date the moment it is printed.
So instead of asking “what is the average,” ask “what does a click need to cost for my math to work, and is mine trending the right way.” That reframe is the whole point of benchmarking against yourself.
What drives Facebook Ads CPC up or down
CPC is an output, not a setting. A handful of factors move it, and most of them are within your control.
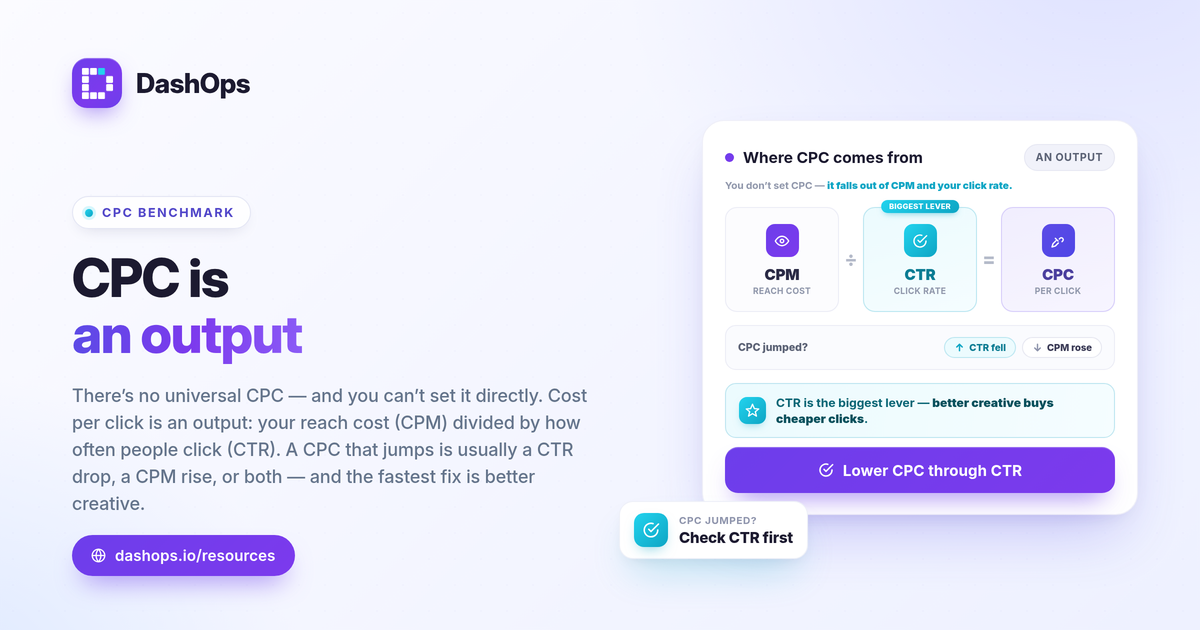
- CTR is the biggest lever. Click-through rate and CPC are tightly linked. When more people click your ad, Meta’s auction rewards you with cheaper clicks; when CTR falls, CPC rises. Strong, relevant creative is the most reliable way to lower cost per click.
- Auction demand. More advertisers competing for the same audience raises the price. This is why CPC climbs in busy retail seasons and around major events.
- Audience. Broad audiences often clear cheaper than tightly defined ones. A narrow, saturated audience drives frequency up and CTR down, which feeds back into a higher CPC.
- Objective and optimization goal. A campaign optimized for link clicks behaves differently from one optimized for conversions or reach. The same Instagram CPC benchmark you saw for a traffic campaign will not hold for a sales campaign.
- Placement. Feed, Stories, Reels, and the Audience Network price differently. Letting Advantage+ placements run usually finds cheaper inventory than locking to one spot.
- Season and timing. Q4, holidays, and sale periods reliably push costs up across the board. A CPC rise in November is often the calendar, not a problem with your ads.
Because these levers move together, CPC is best read alongside CTR and CPM. CPM (cost per 1,000 impressions) times your click rate is effectively what sets your CPC, so a jump in CPC is usually a CTR drop, a CPM rise, or both.
So what is a good CPC, then
Judge it against your own economics, not a leaderboard. Work backward from the result you actually sell:
- Start at the goal. What is your target cost per lead or cost per purchase, and what does your margin allow? Break-even ROAS is 1 divided by your profit margin, which tells you the most you can spend per sale.
- Translate that into a click budget. If you know your landing-page conversion rate, you can see what a click is allowed to cost. Cost per lead is roughly CPC divided by your click-to-lead conversion rate, so a higher CPC is fine if more of those clicks convert.
- Compare to your own history. This is the honest benchmark. Is your CPC up, down, or flat versus last month, and did your downstream cost per result move with it? A higher CPC that still produces cheap leads is not a problem.
A click that looks expensive in isolation can be your best-value click if it converts. A cheap click that never converts is the expensive one. That is why period-over-period comparison beats chasing a universal average: it tells you whether your own efficiency is improving, in the context of your own goals.
Tracking CPC the honest way
The practical question is how to see your CPC trend without rebuilding a spreadsheet every week. DashOps reads CPC alongside CTR, CPM, and your conversion metrics across every Meta ad account in one dashboard, with period-over-period comparison built in, so you can tell at a glance whether a CPC move is a real change or just noise. See what each plan includes on the pricing page, and the help center covers setup. If you want the wider context, our guide to the 17 Meta Ads KPIs to track shows how CPC fits with the rest, and how to benchmark Meta ads performance goes deeper on benchmarking against yourself.
Frequently asked questions
What is a good CPC on Facebook Ads?
How is Facebook Ads CPC calculated?
Why did my Facebook Ads CPC suddenly go up?
See it in your own dashboard
DashOps brings Meta Ads reporting, campaign management, and white-label client portals into one place. Pick the plan that fits how you run ads.