Device and Platform Breakdown in Meta Ads: Mobile vs Desktop vs Instagram Reporting
A device and platform breakdown in Meta Ads splits your results by where each impression and conversion happened: mobile versus desktop, and Facebook versus Instagram (plus Audience Network and Messenger). The point is simple. The same campaign can be efficient on one surface and wasteful on another, and a single blended number hides that. Reading the device and platform breakdown for Meta Ads tells you where the money actually worked, so you can shift budget toward what performs instead of guessing. This post explains what each split shows, how to read it without overreacting, and how a dashboard surfaces it for a budget decision.
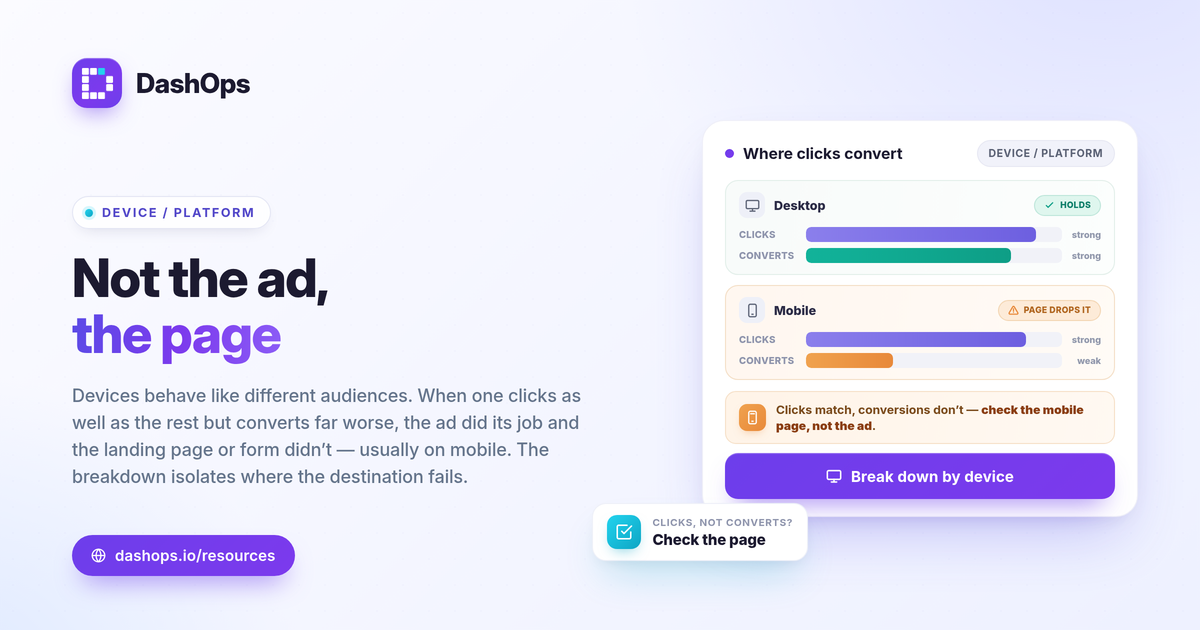
What the device and platform breakdown actually shows
Meta lets you slice the same KPIs you already track by the surface the ad ran on. There are two related cuts:
- Device. Mobile versus desktop. This is the mobile vs desktop Facebook ads question: where do people see your ad and where do they convert.
- Platform and placement. Facebook, Instagram, Audience Network, and Messenger, and within those the feed, Stories, Reels, and right column. This is the Instagram vs Facebook performance view.
Every metric you care about (spend, impressions, reach, clicks, CTR, CPC, CPM, ROAS, purchases, leads, cost per lead) can be read per segment. So instead of one CPC for the whole campaign, you get a CPC for Instagram Reels on mobile, a separate one for Facebook feed on desktop, and so on. A platform breakdown report is just these numbers laid out side by side.
Why the split matters for budget decisions
Meta’s Advantage placements deliver wherever the system predicts the cheapest result. That is usually fine, but it means your spend lands on whichever surface the algorithm favors, not necessarily the one that fits your goal. Device level ad reporting is how you check that distribution against reality.
A few patterns show up often enough to look for:
- Mobile carries the volume, desktop carries the intent. Many lead-gen and high-consideration offers see more form completions or higher-value actions on desktop, even though mobile gets most of the impressions.
- Instagram drives reach, Facebook drives conversions. Or the reverse, depending on your audience. The only way to know for your account is to read the split.
- One placement quietly drains spend. A surface with cheap clicks but no conversions can look healthy on CTR and still cost you results.
None of these are rules. They are reasons to open the breakdown rather than trust the blended average.
How to read mobile vs desktop without overreacting
The trap is to see a lower cost per result on one device and move all the budget there. Resist that. Read each segment against three things, not against a universal benchmark:
- Your own goal and margin. Judge ROAS against your break-even ROAS (1 divided by your profit margin), and judge cost per lead against what a lead is worth to you. A desktop CPL that looks high in isolation may still be profitable if those leads close better.
- Volume, not just efficiency. A platform with the lowest CPC but a tiny share of conversions is not your winner. Look at cost per result and total results together.
- The prior period. Use period-over-period comparison to see whether a segment is improving or sliding. A single snapshot can mislead; a trend tells you whether to act.
When a segment genuinely underperforms across volume, efficiency, and trend, that is your signal to test a budget shift or a placement exclusion. Change one thing, then read the breakdown again.
Instagram vs Facebook: comparing platforms fairly
When you compare Instagram vs Facebook performance, keep the goal fixed and let the formulas do the work rather than eyeballing raw counts. The relationships are the same on every platform:
| Metric | How it is calculated |
|---|---|
| CTR | clicks / impressions |
| CPC | spend / clicks |
| CPM | spend / impressions times 1000 |
| ROAS | conversion value / spend |
| Cost per lead | spend / leads |
A platform with a high CPM is not automatically worse. If that same surface delivers a strong ROAS or a low cost per lead, the higher CPM is buying better outcomes. Always trace the number back to the result you care about before you judge it.
How a dashboard surfaces device and platform breakdowns
In Meta Ads Manager you can add the breakdown columns, but you are toggling menus per campaign and re-exporting every time you want a clean comparison. A reporting dashboard keeps the platform breakdown report standing so the split is one view, not a build. DashOps reads your Meta placement and device numbers across every connected ad account, with period-over-period comparison built in, so you can see mobile versus desktop and Instagram versus Facebook side by side and spot the segment that is pulling weight or wasting spend. The lead-gen versus e-commerce KPIs adapt automatically, so a lead account shows cost per lead per platform while a sales account shows ROAS. See what each plan includes on the pricing page, and the help center covers connecting an account and reading the breakdowns. If you are deciding which numbers to watch alongside these splits, the Meta Ads KPIs to track post is a good companion, and Ads Manager vs a reporting dashboard covers why the standing view saves the rebuild.
The practical takeaway: open the device and platform breakdown before you reallocate budget, and let the worst-performing segment, judged on your own goal and trend, tell you where to cut.
Frequently asked questions
What is a device and platform breakdown in Meta Ads?
Should I move all my budget to whichever platform has the lowest cost per result?
Why does mobile usually get most of the spend in my Facebook ads?
See it in your own dashboard
DashOps brings Meta Ads reporting, campaign management, and white-label client portals into one place. Pick the plan that fits how you run ads.