How to Explain ROAS to a Client Without Losing Them
A client asks what ROAS means and you say “return on ad spend.” They nod. Two weeks later they ask why you’re spending so much on ads that “aren’t returning anything,” pointing at a campaign whose ROAS you were pleased with. The definition landed. The meaning did not.
That gap is the actual problem. ROAS is a ratio, and ratios are slippery for anyone who has not spent years staring at them. A client hears a number, tries to attach a feeling to it, and lands on the wrong feeling. So when you set out to explain ROAS to a client, your job in the meeting is not to define the acronym. It is to give them a way to judge whether the number in front of them is good or bad for their business, and to know what you will do about it either way.
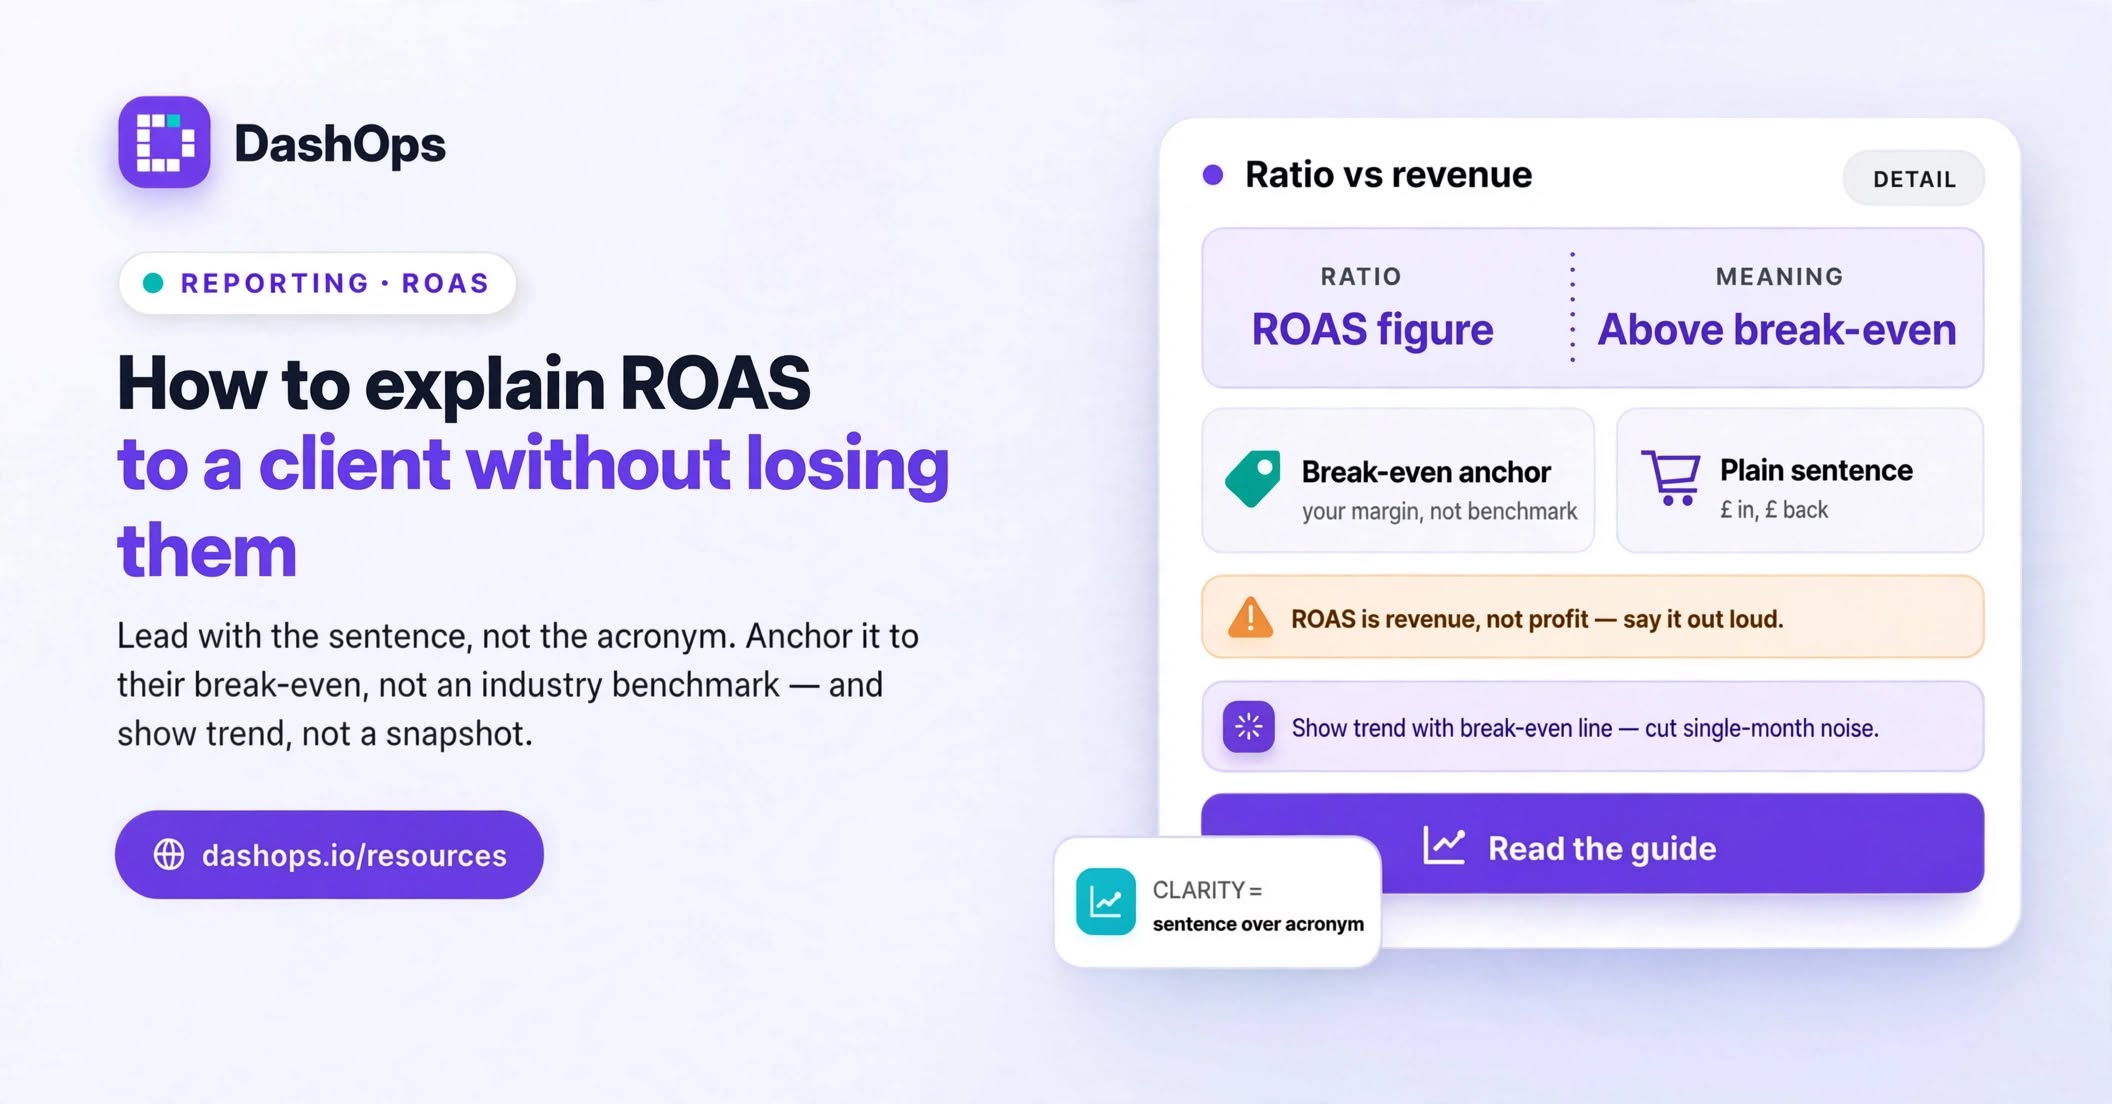
Start with the sentence, not the acronym
Do not open with “ROAS stands for.” Open with the plain sentence the ratio is trying to say.
“For every pound you put into ads last month, the ads brought back this much in tracked revenue.”
Then say the number. Then stop talking and let them react.
Leading with the sentence does two things. It puts the client’s own money at the centre, which is what they care about, and it quietly establishes that ROAS is a comparison between two amounts rather than a score out of ten. When you lead with the acronym you have to teach a term and a concept at once, and most people only absorb the term.
If your client is more comfortable with multiples, phrase it as “the ads returned a multiple of what you spent.” If they think in currency, keep it in currency. Match how they already talk about money in their own business.
Anchor it to their break-even, not to an industry number
This is the single most useful thing you can do, and it is the part most reports skip.
A ROAS figure means nothing on its own. It only means something against the point where the client stops losing money. That point depends on their margins, and only they know their margins. So ask, early in the relationship and in writing:
- What does it cost you to make or buy the thing you sell, per unit?
- What do you pay to ship and process a typical order?
- What other costs come out before you count a sale as profit?
- Are you happy to break even on a first order to win a repeat customer, or does every order need to pay for itself?
From those answers you can work out with them, live, the ROAS at which their ads wash their face. Do the arithmetic together on a call so they watch it happen. Once that number exists, every future conversation gets easier, because the client is no longer asking “is this good?” They are asking “are we above or below the line we agreed?”
Resist the urge to fill this gap with a benchmark. Telling a client that a certain ROAS is normal for their industry invites them to judge your work against a number neither of you can verify, and it replaces a real, business-specific threshold with a vague one. Their break-even is the only benchmark that matters.
Explain what ROAS deliberately ignores
Clients get burned when they treat ROAS as a measure of profit. It is not. It is revenue divided by ad spend, and revenue is not profit. Say that out loud before they discover it themselves.
Three things worth naming explicitly:
- Cost of goods. ROAS counts the money that came in from a sale, not what it cost you to fulfil it.
- Your fee and other overheads. The ad account does not know about them.
- Sales the ads influenced but did not get credit for. Someone sees an ad, does not click, searches for the brand later and buys. Meta’s reporting attributes what it can see, within a set attribution window. Someone who buys long after that window, or on a device Meta cannot connect, may not appear.
That last point matters most in the other direction too. A client who is watching their own back-end numbers will sometimes see more total revenue than the ads report claims. Tell them why before they think you are inflating figures, or hiding them.
Show the trend, not the snapshot
A single month’s ROAS is noise wearing a suit. One large order can lift it. One slow week can sink it. If you present one number in isolation, you invite a reaction to randomness.
Present it as a line over time instead, and state the agreed break-even alongside it so the client has something to judge that line against. Now the conversation is about direction, which is what you can actually influence. In DashOps the dashboard shows period-over-period comparison alongside trend charts, so the current figure sits next to the previous period rather than floating alone, and the same figures carry through to the PDF and Excel reports you send.
Pair the trend with the two numbers underneath it: what was spent, and what came back. When a client can see both inputs, the ratio stops feeling like a black box, and they can sanity check it against their own sales records.
Handle the two hard conversations before they happen
“ROAS went up, so why is revenue down?” Because you spent less. A smaller budget spent on the warmest audience often produces a flattering ratio and a smaller business. Say early that you can push ROAS up almost any time by shrinking spend, and that this is usually the wrong trade. Agree together whether the goal is the highest ratio or the most profit at an acceptable ratio. Those are different jobs and they lead to different campaigns.
“ROAS dropped, what went wrong?” Sometimes the honest answer is that you deliberately expanded into colder audiences, or tested new creative, and a dip was the expected cost of finding the next thing that works. That only reads as competence if you said it in advance. Flag planned experiments before the numbers move, not after. There is more on framing a weak period inside a regular report in what belongs in a monthly Meta Ads report.
Put it in writing where they will actually see it
Say it well on the call and it fades almost as soon as the call ends. The version that lasts is the one sitting in their inbox or on a dashboard they can open themselves.
Write one short paragraph in your reporting that repeats the plain-language sentence, states the agreed break-even, and says whether you are above or below it. Reuse that same wording every period. Consistency is what turns an explanation into a shared vocabulary, and a client who has read the same framing several times starts using it back at you, which is when you know it worked.
If the client has a read-only login they can check between meetings, the explanation gets reinforced without you being in the room. DashOps supports Client users with read-only access to the ad accounts you assign them, so they can see the same figures you present, on a dashboard carrying your branding. Whether they log in or wait for the report, the words should be identical in both places. For more on what clients actually read, see this Facebook Ads client report template.
What to do next
Before your next reporting call, do three things. Ask the client for their per-unit costs and work out their break-even ROAS with them on the call, so it is a shared number rather than one you handed down. Write your plain-language sentence once and paste it into your reporting template so it never changes. Then write the agreed break-even next to the ROAS figure in the report itself, so every future report answers “above or below?” without anyone having to ask.
If your reporting call still spends more time on definitions than decisions, the wider structure of the meeting may be the issue rather than this one metric. How to present Facebook Ads results to clients covers the whole session, from what to lead with to how to close on next steps.
Frequently asked questions
What is the simplest way to explain ROAS to a client?
Should I tell a client what a good ROAS is for their industry?
Why does ROAS look different from the revenue in the client's own system?
How do I explain a ROAS that went up while revenue went down?
How often should I repeat the ROAS explanation?
See it in your own dashboard
DashOps brings Meta Ads reporting, campaign management, and white-label client portals into one place. Pick the plan that fits how you run ads.